Perspective on the quarter, with simple takeaways and visuals.
TFO Wealth Partners is thrilled to introduce a new quarterly series hosted by Chief Investment Officer, Matthew Sheridan. This quarterly note is meant to keep you informed on the markets and the economy with simple visuals and takeaways. Each update includes a short article, a few charts, and a brief video. The goal is simple: help you focus on what we believe matters most. See below for Matt’s take on the markets for this past third quarter.
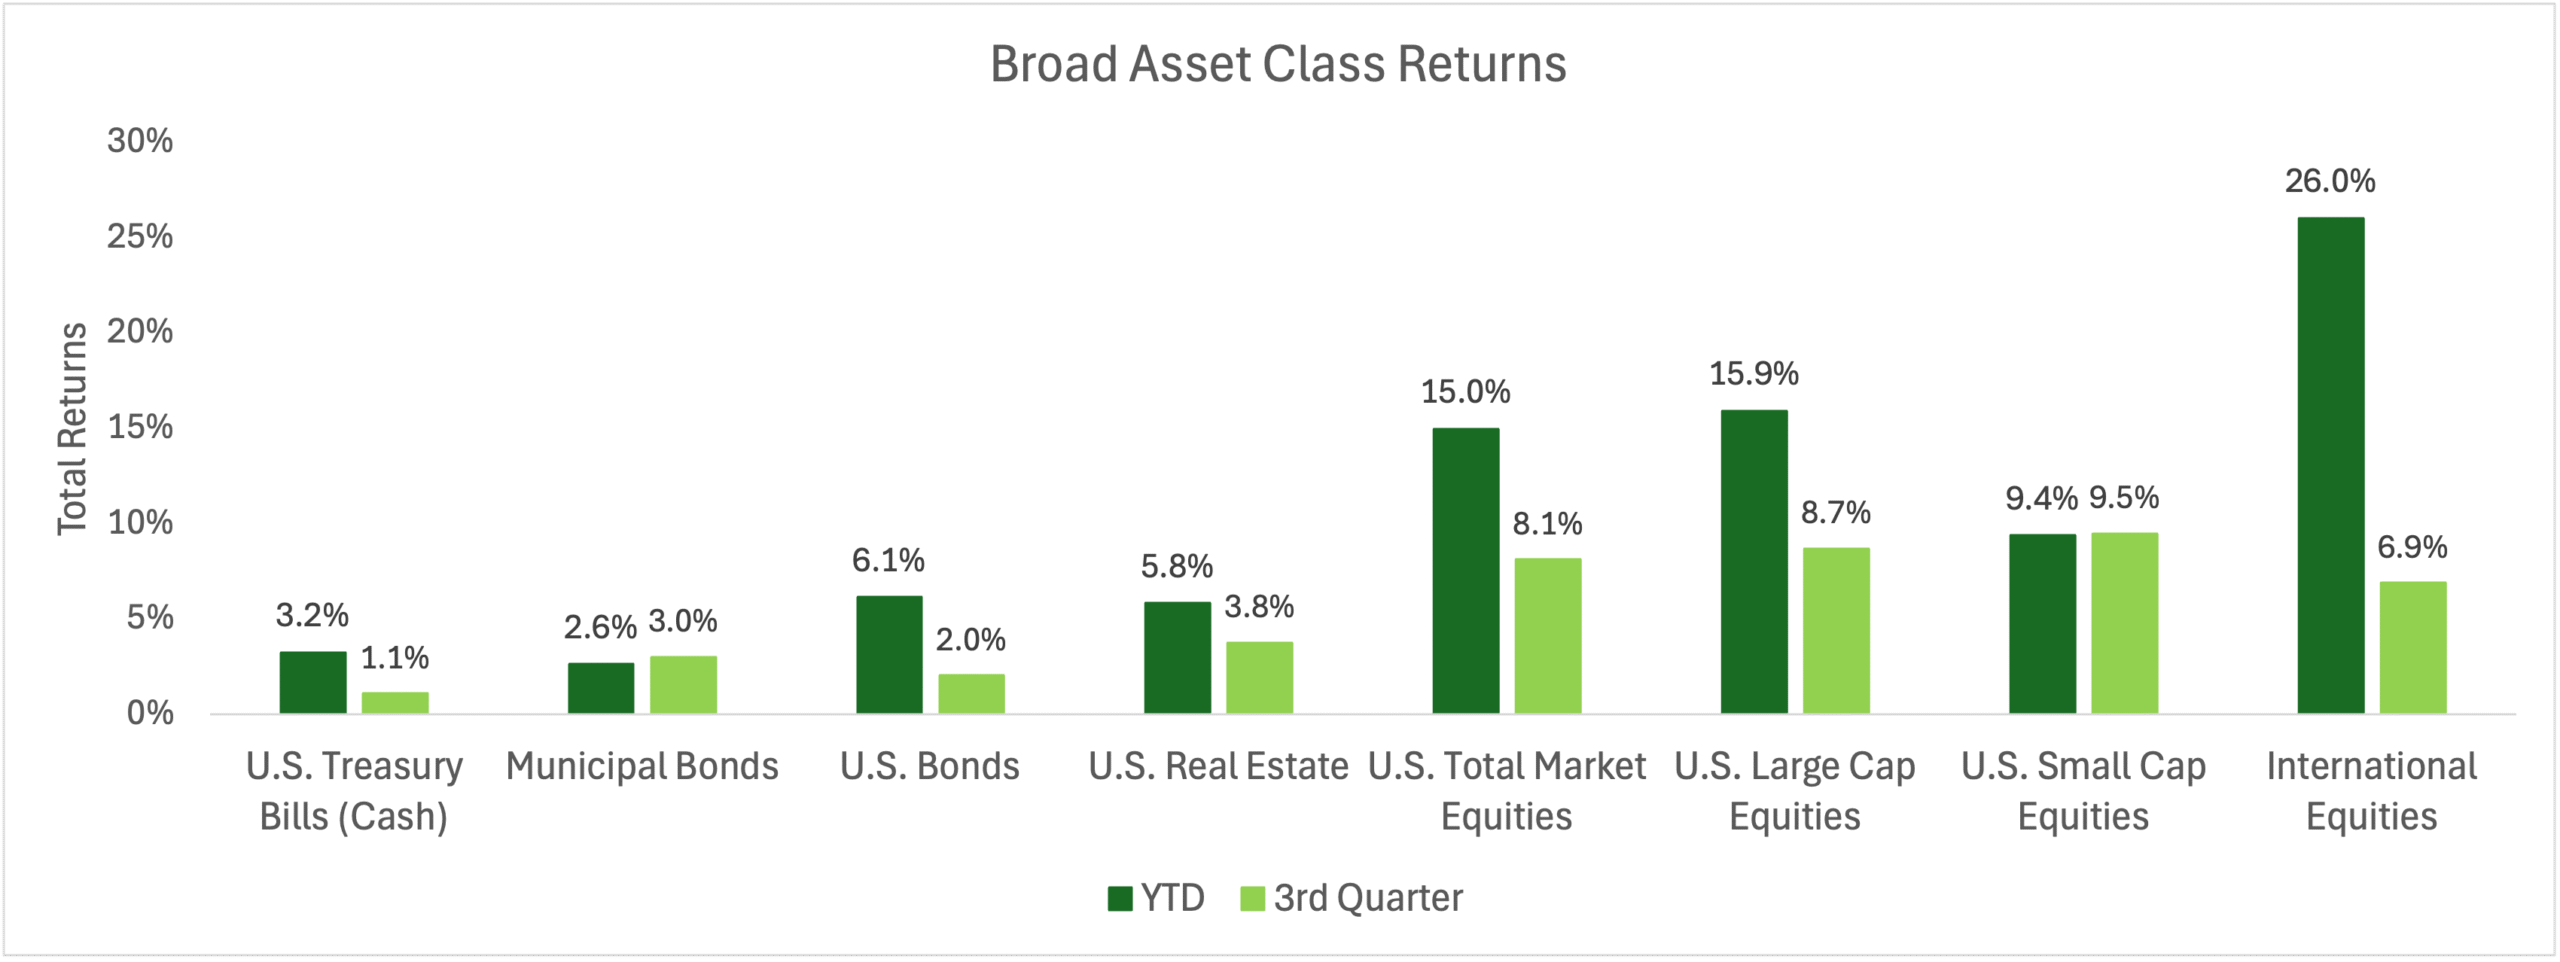
Source: YCharts, as of 9/30/2025; Indices – Bloomberg US Treasury Bills 1-3 Month, Bloomberg Municipal Bond, Bloomberg US Aggregate, MSCI USA, MSCI USA Large Cap, MSCI USA Small Cap, MSCI US IMI Real Estate 25-50, MSCI ACWI Ex-USA Net
Q3 was a strong quarter across the board. Global stocks rose at least 7% and bonds gained 2% or more. Outside of lingering concerns surrounding the economic impacts of tariffs, attention was centered around the Federal Reserve. For the first time since December of 2024, the Fed cut rates by 0.25% to a new target range of 4.00-4.25%, citing cooling inflation and a softer labor market.
Two quick capital markets highlights:
- Municipal bonds. Muni returns were negative through June, so all gains for the year arrived in Q3. Supply pressures, like issuers rushing to market ahead of possible tax-law changes and higher post-COVID project costs, combined with rate volatility held back returns for much of the year. Things changed quickly in Q3 with final clarity around tax law certainty (OBBBA avoided material changes) and interest rate volatility (Fed cuts relieved pressure).
U.S. small caps. Similar to municipal bonds, small caps were negative through June, and all gains came in Q3. Small caps tend to be more interest rate sensitive compared to their large caps peers, so changes in levels or even expectations of the direction of interest rates (e.g., Federal Reserve policy shifts) can have an outsized impact on the asset class. They finished Q3 as a key contributor.
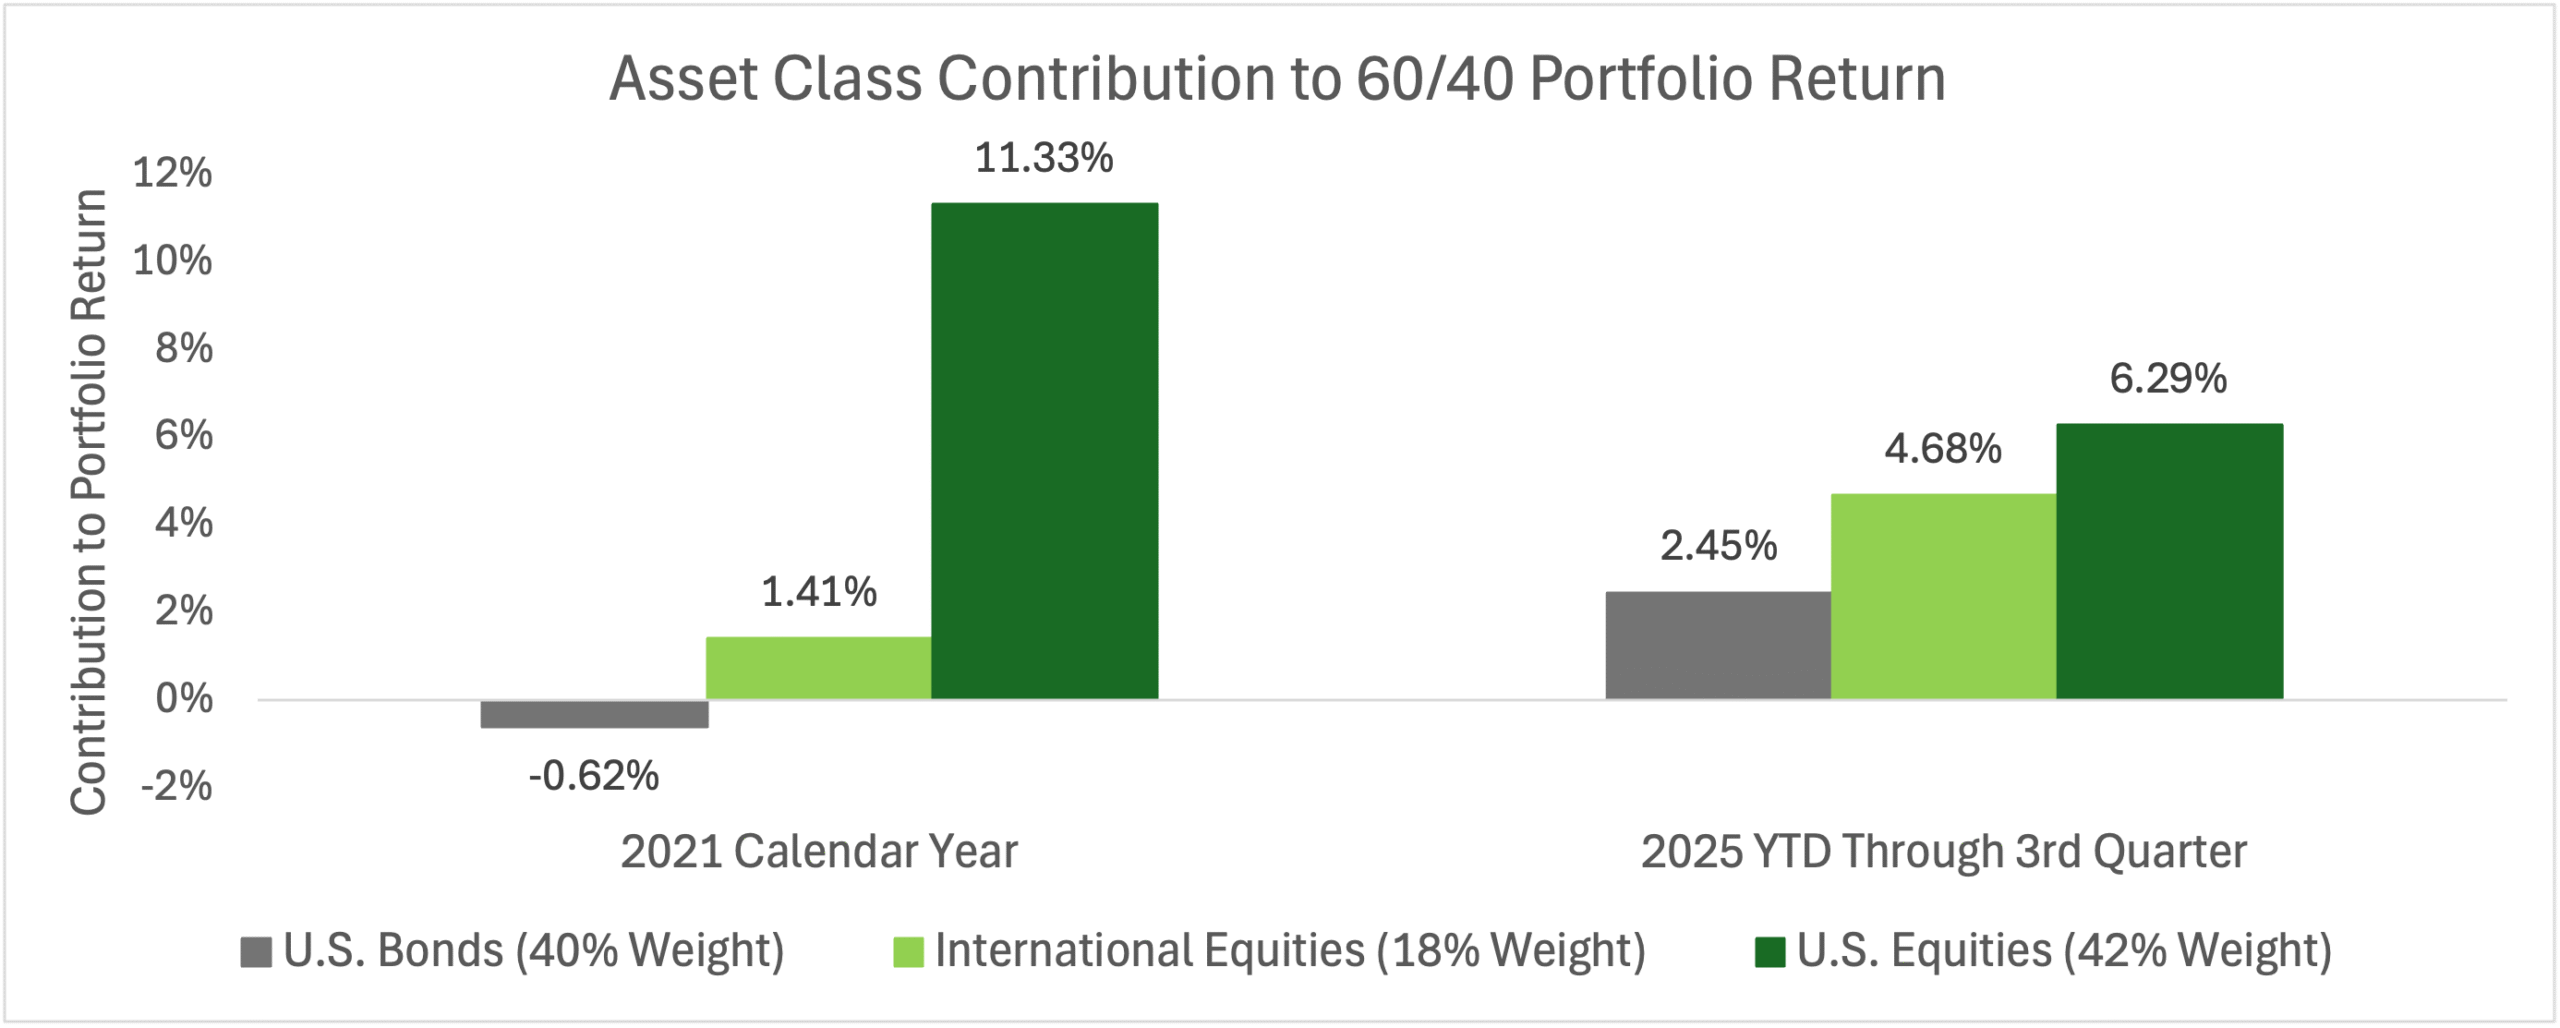
Source: YCharts, TFO Calculations, as of 9/30/2025; Indices – Bloomberg US Aggregate, MSCI ACWI Ex-USA Net, MSCI USA; (x%) in legend represents asset’s weight in portfolio.
Fixed income is now doing more of the work after years of historically low yields. Bonds are up 6.1% through Q3, driven mostly by yield, which is a benefit that results from the painful reset bond investors went through in 2022. International equities have also been a strong contributor, up about 26% through Q3.
Returns for diversified portfolios are now coming from more places. Consider a 60/40 portfolio: In 2021, U.S. equities made up roughly 93% of the portfolio’s return; so far in 2025, they account for roughly 47% of the portfolio’s return, which is closer to their actual weight in the portfolio. This is what you want. A broader return base is healthier and more durable for wealth accumulation, and this reality goes squarely against the calls for “the death of the 60/40” headlines you’re sure to see every now and again.
(Context: we compare today’s return composition to 2021 for two reasons: first, it was the last full year with historically low bond yields a the 10-year Treasury averaged about 1.44% then, versus about 4.36% in 2025, highlighting how important starting yields are to bond total returns; second, the total returns for the full year 2021 and through Q3 2025 are similar on the portfolio level.)
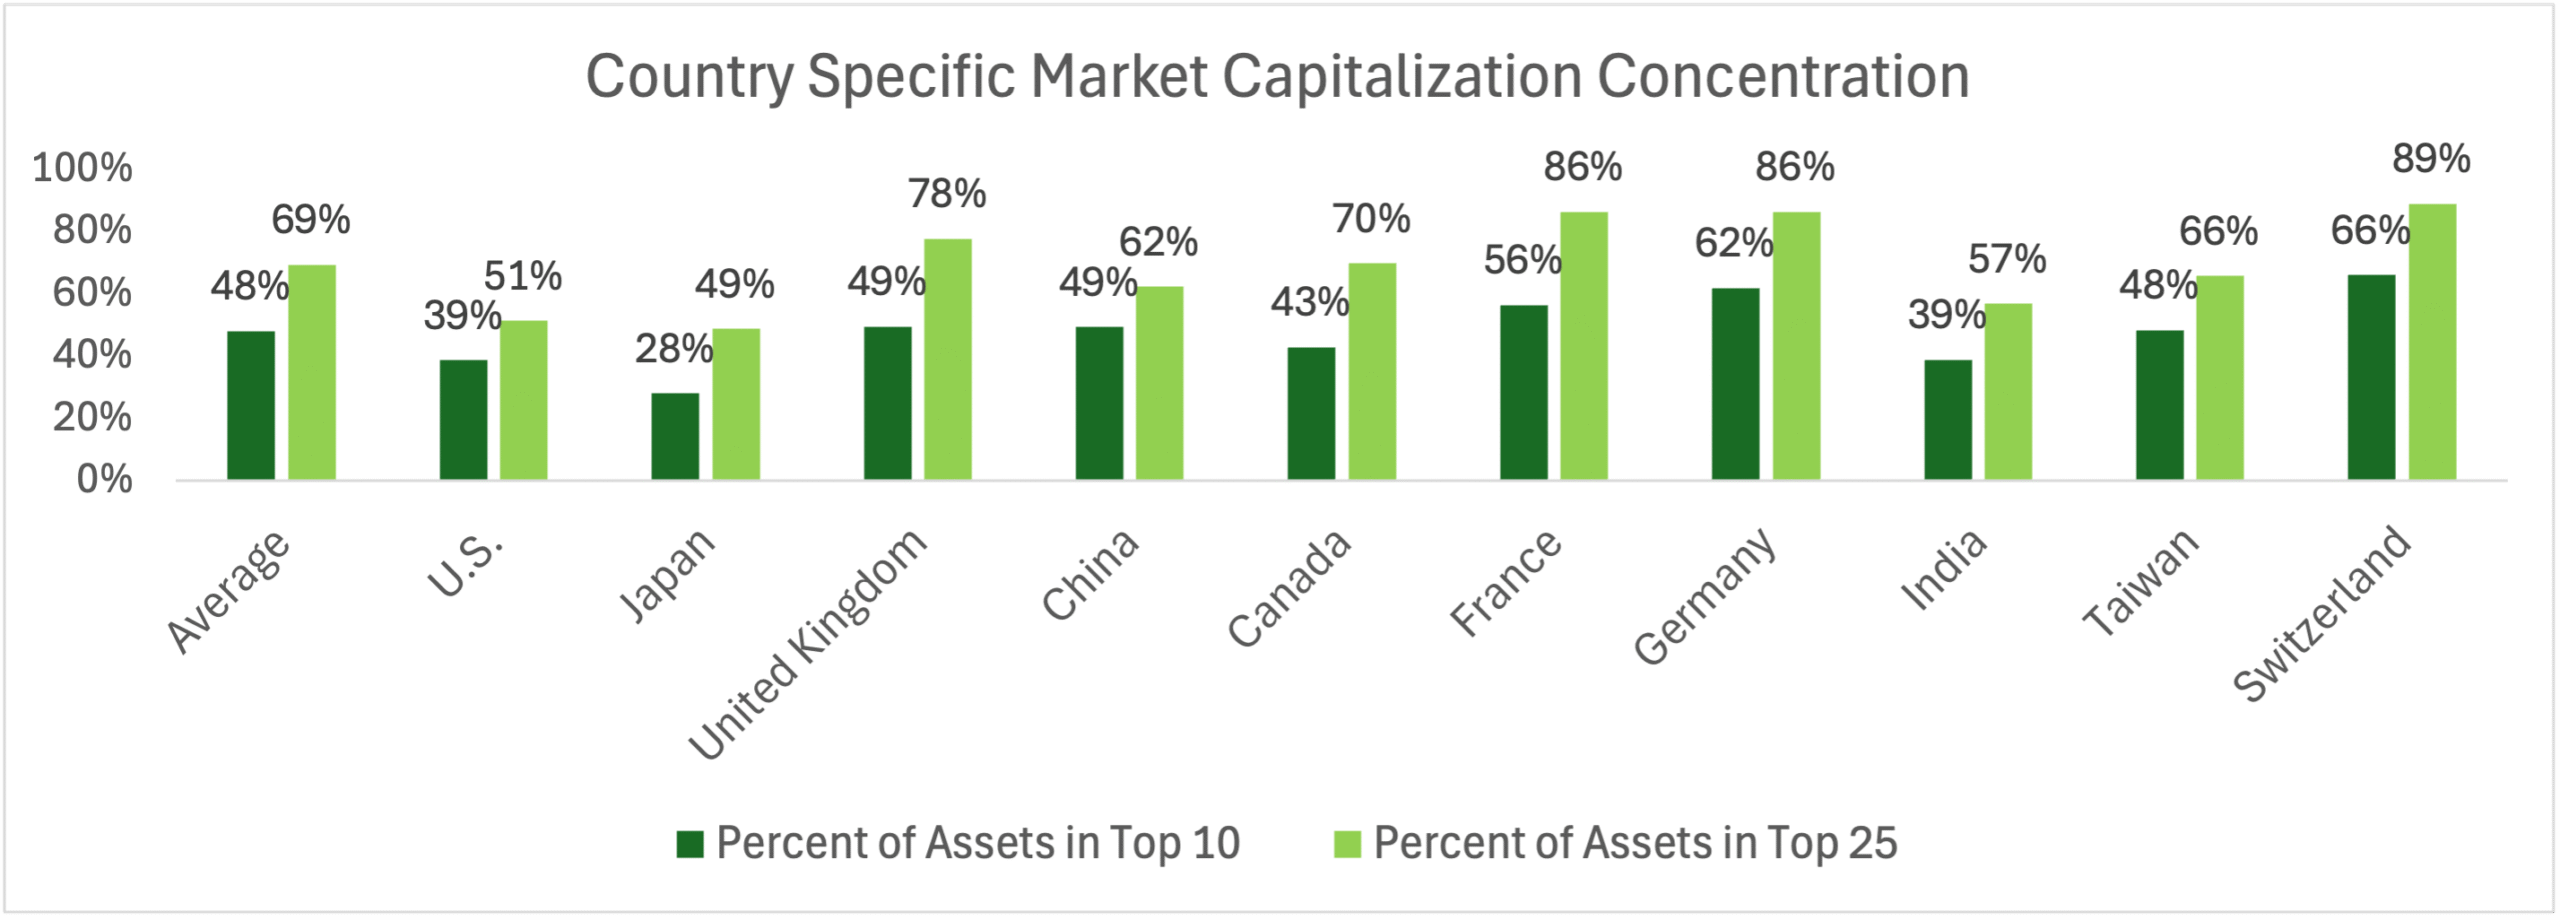
Source: YCharts, MSCI, S&P DJI, as of 9/30/2025
Large companies around the world carry more weight today; there are 11 separate companies in the world that are now worth more than $1 Trillion in market value (9 are U.S. companies).1
This can sound frightening at first, but here are a few points to keep in mind:
- There are fundamental reasons for this, and size today reflects real profits and high margins. Take the U.S. as an example: by the end of Q3, the weight of the 10 largest stocks in the S&P 500 Index was 39%, but their contribution to trailing earnings for the index was 33%, with 2x higher profit margins, and 3x higher expected earnings growth over the next 12 months.2
- Concentration is a global phenomenon. Most of the largest countries outside of the U.S. have a higher share in their top 10 and top 25 largest stocks. Headlines portending an imminent collapse in asset prices based on U.S. public company size are missing the forest for the trees.
It is true that large U.S. companies are much bigger than international large companies. This doesn’t happen just because. Example: Walmart ranks #1 in the globe in terms of revenue with trailing 12-month sales of roughly $693 billion3, a level that would put it in the top 25 largest “economies” in the world if it were a standalone country, underscoring just how large U.S. corporate scale has become.4
What to do with this
Use this as a reminder that context matters.
Not every quarter will look this steady, and when conditions change, we’ll be clear about what it means.
For now, the basics still apply: stay diversified across asset classes and regions, rebalance your allocations regularly, and remain disciplined in your approach.
1 YCharts, CompaniesMarketcap.com 2025, as of 9/30/2025
2 J.P. Morgan Guide to the Markets, YCharts, TFO calculations, as of 9/30/2025
3 YCharts, as of 9/30/2025, trailing 12-month revenue
4 World Bank, as of 12/16/2024, Worldometer.info, Past Performance is no guarantee of future returns. The performance of an index is not an exact representation of any particular investment, as you cannot invest directly in an index.
Advisory services provided by TFO Wealth Partners, LLC. We believe this information provided is reliable, but do not warrant its accuracy or completeness. This material is provided for informational purposes only.
Asset allocation and diversification do not assure or guarantee better performance and cannot eliminate the risk of investment losses. Past performance may not be indicative of future results. Therefore, no current or prospective client should assume that the future performance of any specific investment or strategy will be profitable or equal to past performance levels. All investment strategies have the potential for profit or loss. Different types of investments involve varying degrees of risk, and there can be no assurance that any specific investment will either be suitable or profitable for a client’s portfolio. There are no assurances that a portfolio will match or outperform any particular benchmark.
445bWP – 2025.10


