

A great deal is being written about bonds and interest rates, and most of it comes back to the same three concerns: government debt, corporate borrowing, and inflation. Each is real, and each could influence where interest rates go from here.
But investors do not get to evaluate those risks in isolation. Bond prices and yields already reflect what lenders collectively believe about deficits, borrowing and inflation, and those expectations will continue to change as new information arrives. The relevant question is not whether risks exist. It is what investors are being paid to take them.
That is why the starting point matters. Rather than trying to predict where interest rates go next, this paper looks at where bond returns come from, what today’s yields tell us, and the job bonds can play in a portfolio.
A bond’s return comes from two places: the income paid while the bond is outstanding and any change in its price. If held to maturity and assuming no default, the investor is repaid the bond’s face value. If sold earlier, its price will depend largely on prevailing interest rates and the bond’s sensitivity to those changes (i.e., its duration). When rates rise, an existing bond generally becomes less valuable. When rates fall, it generally becomes more valuable.
Although price movements get most of the attention, income carries most of the weight over a full investment horizon. That is why the yield available when a bond is purchased matters so much. Investors naturally judge an investment by what it has done recently. For bonds, however, recent returns have historically told investors much less about the next decade than the yield available at the start.
Much of the historical analysis that follows uses U.S. Treasuries because they provide the cleanest way to isolate interest-rate risk over long periods. Other bonds may also compensate investors for taking credit risk or, in the case of municipal bonds, offer tax-exempt income. Treasury yields serve as the baseline from which those additional risks and benefits are priced.
Using Treasury data going back to 1871, what bonds earned over the prior decade explains about 24% of what they earned over the next one. The yield available at the start explains about 91%. That history spans inflationary and deflationary environments, wars and depressions, booms and busts.
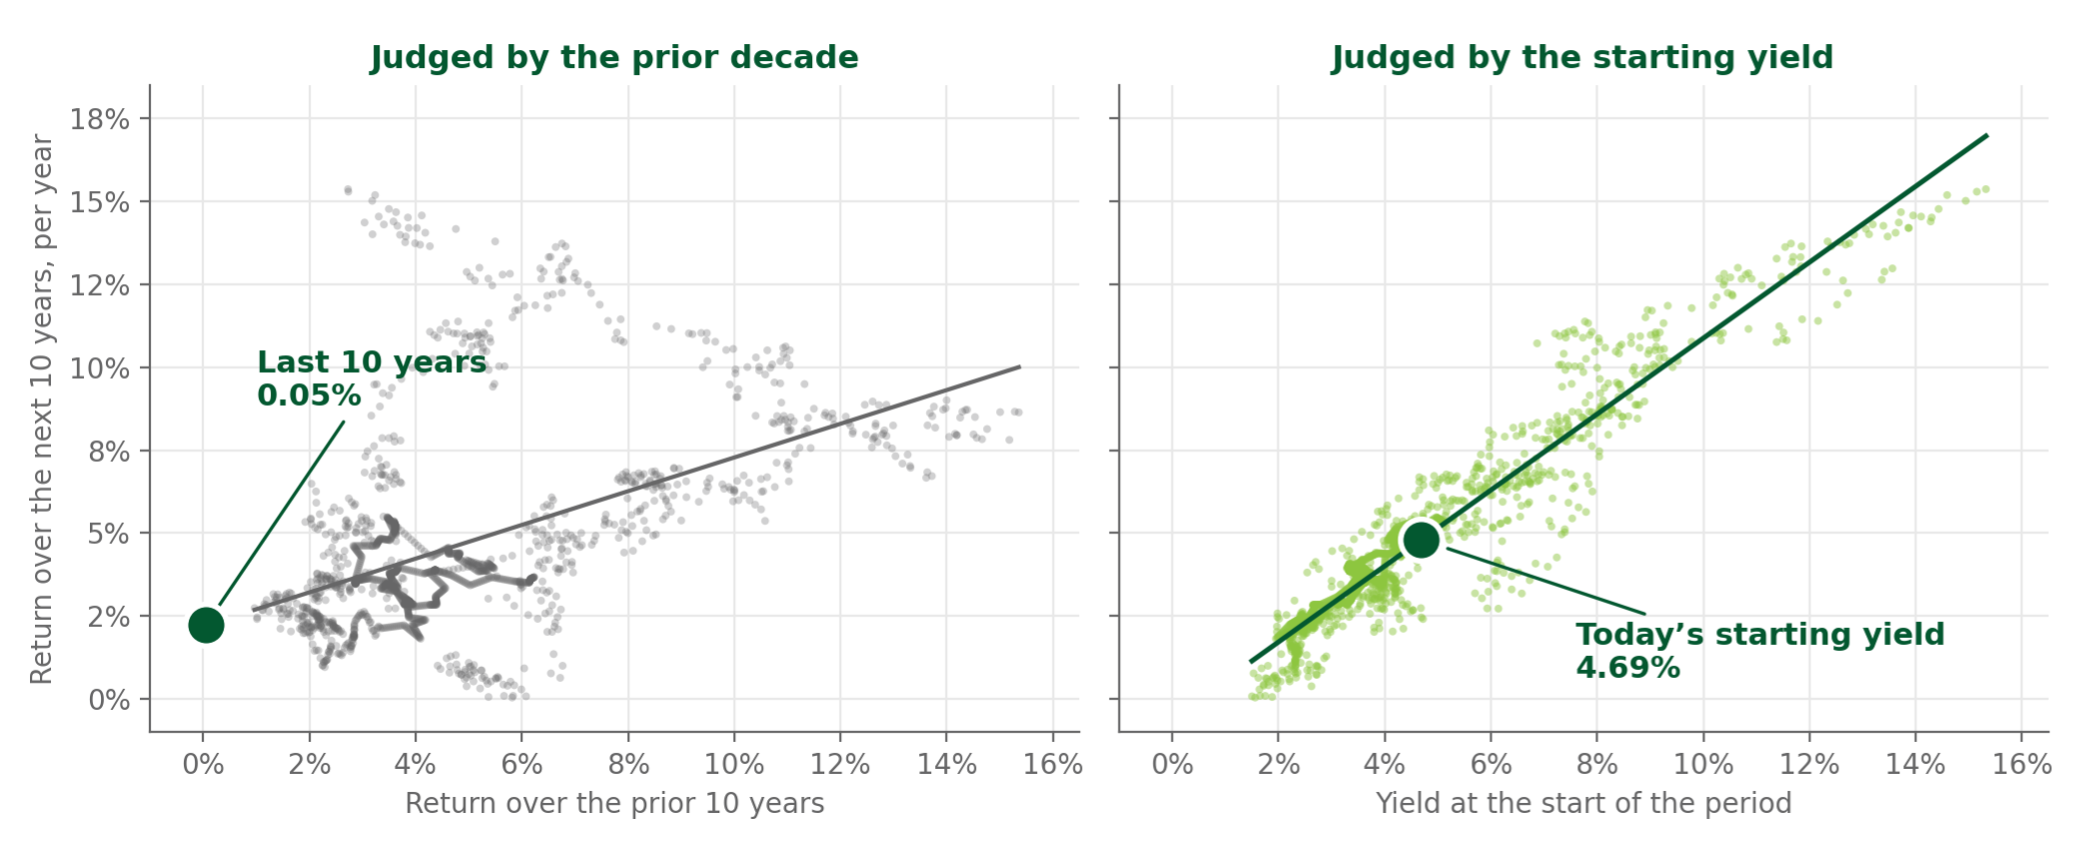
Each point is one month since 1881. Vertical axis on both panels: the annualized return over the 10 years that followed. Left horizontal axis: the annualized return over the 10 years before that month. Right horizontal axis: the 10-year Treasury yield at that month. The return series is a 10-year Treasury held and rolled continuously to keep its maturity at 10 years.
Source and methodology: See Note 1 and Note 2.
The difference becomes even more clear when both are considered together. Once the starting yield is known, adding the prior decade’s return increases the explanatory power from 91.4% to just 92.4%. Starting with the prior return and then adding yield takes it from 24% to 92.4%.
In other words, the past decade is not an independent signal about the next one. Most of the useful information has historically been in the yield available when the new period begins.
The most recent trailing 10-year return in this Treasury series is roughly flat. Judging the next decade by the one investors just experienced would therefore paint a very different picture from today’s 4.69% starting yield.
The rate reset that produced the difficult experience behind us is also what produced the higher starting yield in front of us. Rising rates can still create meaningful price declines along the way, so a useful rule of thumb is to hold a bond portfolio longer than its duration (i.e., its approximate sensitivity to changes in interest rates). Doing so increases the likelihood that the yield you start with will be a good guide to the return ultimately earned.
Bond investors are once again being paid to invest across the yield curve, a very different starting point from the low yields available five years ago.
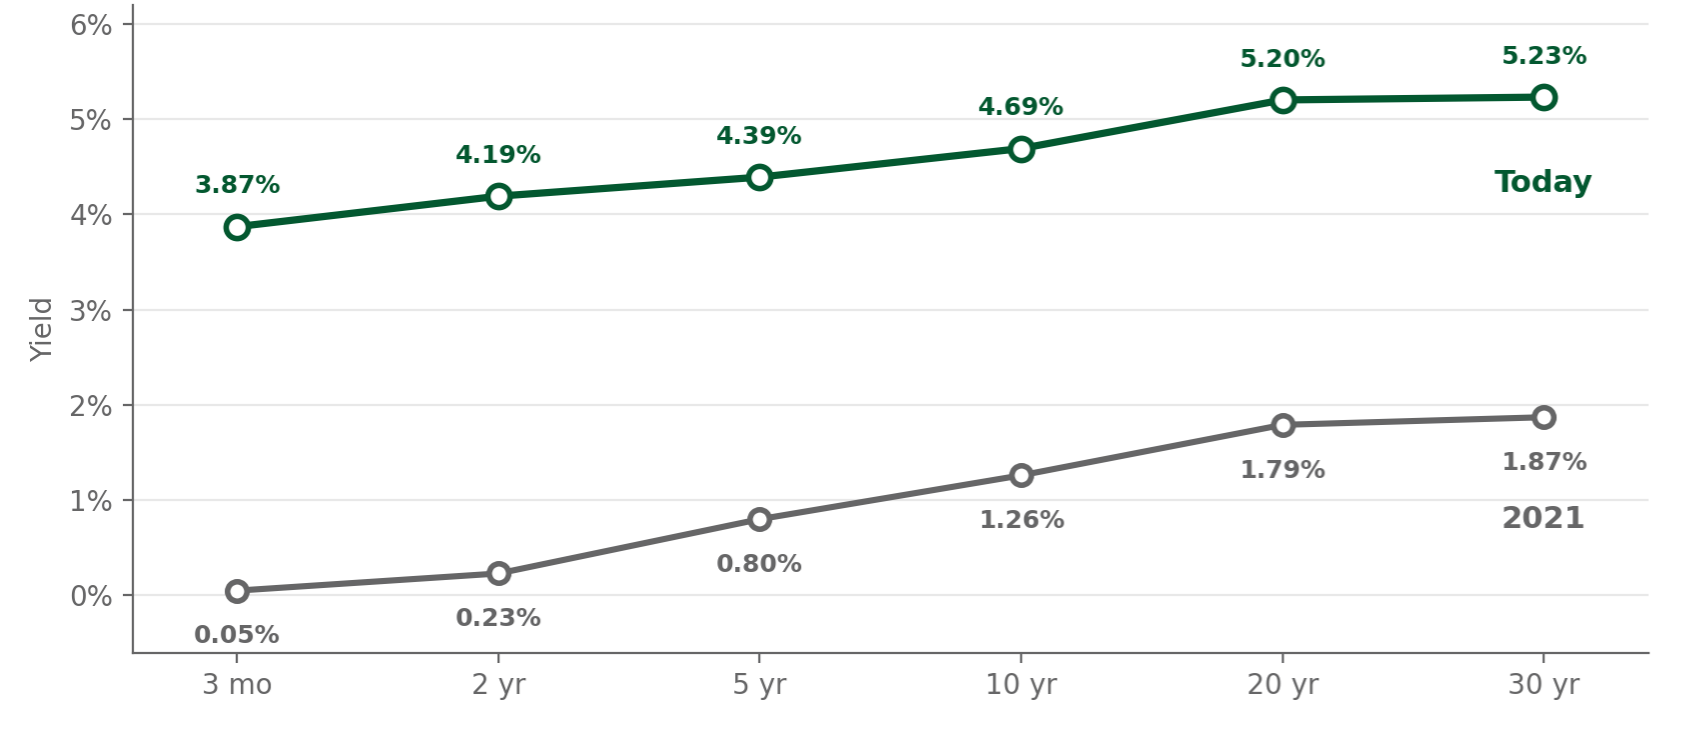
Source: US Treasury constant-maturity yields via YCharts. See Note 3.
A 10-year Treasury yield approaching 5% can sound unusually high after the past decade. A longer view tells a different story.
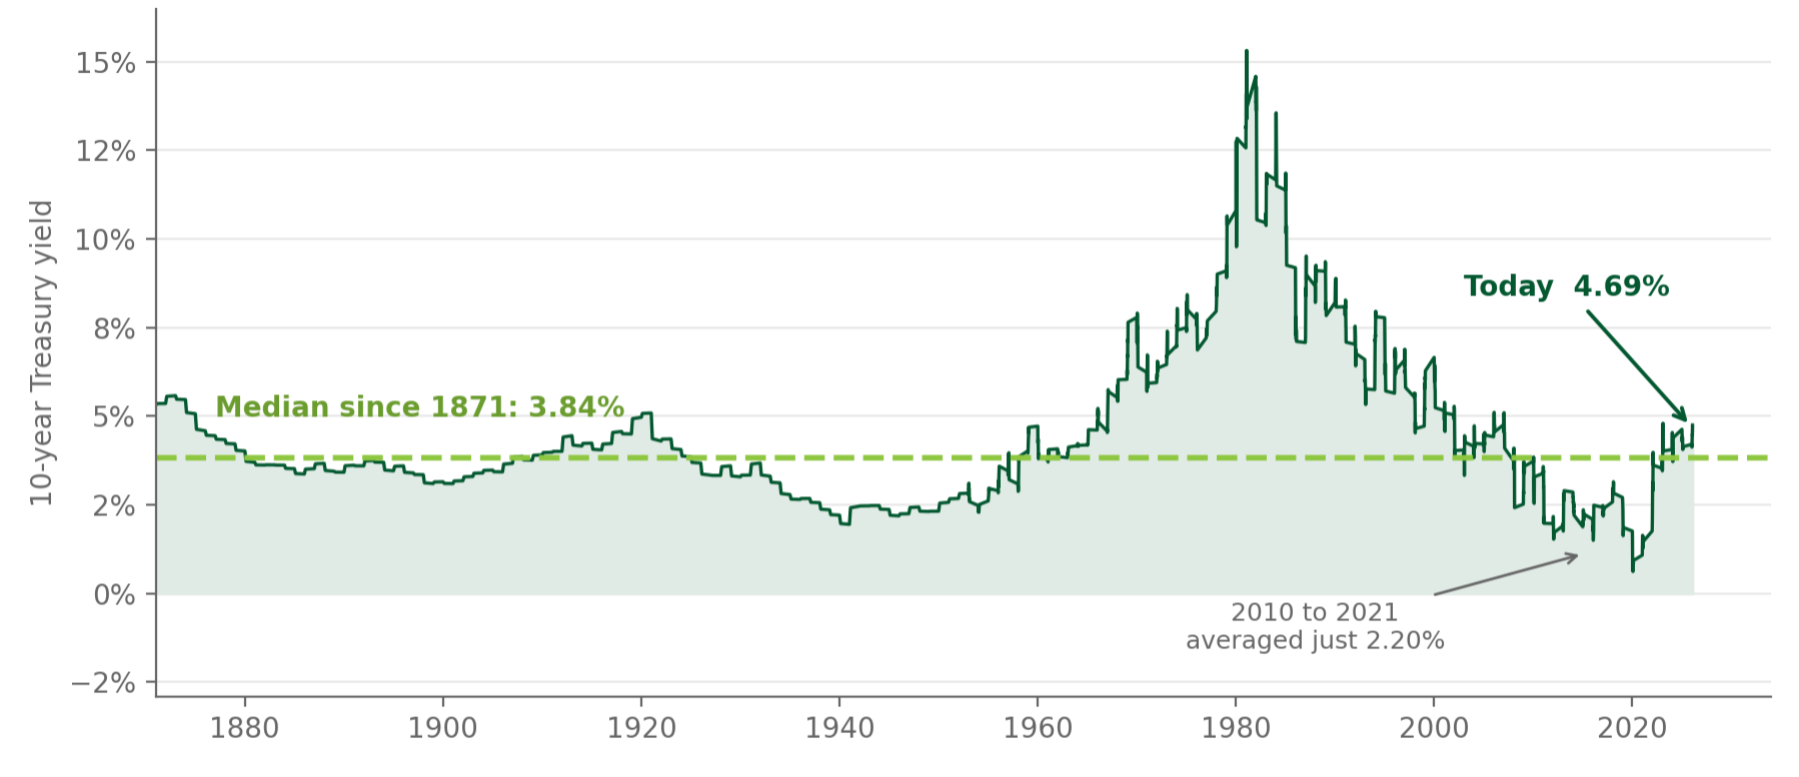
Source: Shiller dataset, 1,868 monthly observations from January 1871 through August 2026. See Note 4.
Today’s 4.69% yield is above the 3.84% median since 1871, but still well within historical experience. The unusual period was the one just behind us: from 2010 through 2021, the 10-year Treasury averaged only 2.20%, an exceptionally low starting point even by long-term standards.
Income matters in two ways. It is the primary source of a bond investor’s return over time, and it provides a cushion against shorter-term price fluctuations along the way. There was very little cushion heading into 2022, using an illustrative broad taxable bond yield of roughly 1.2%.
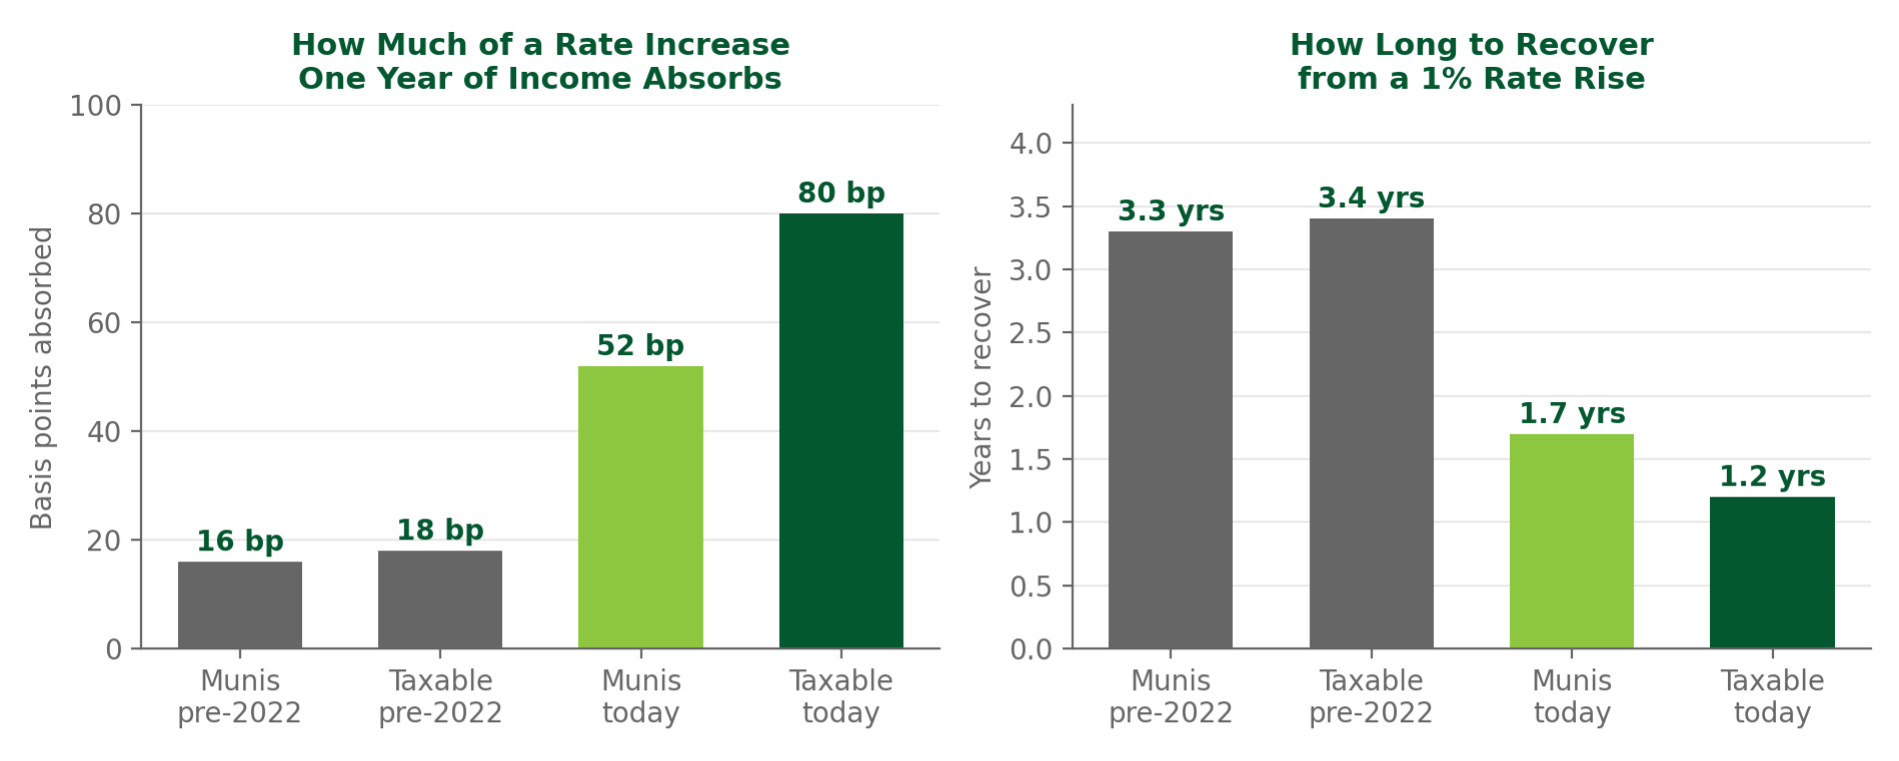
Left: the approximate rate increase that 1 year of income absorbs. Right: approximate time to recover from a 1% rise in rates.
Source and methodology: See Note 5. These figures are illustrative. Actual outcomes depend on credit quality, sector, maturity structure and whether bonds are held individually or through a fund, each of which carries its own trade-offs.
Today, that starting yield cushion is considerably larger. A hypothetical 1% increase in rates heading into 2022 would have required about 3.4 years of income to offset the price decline. At today’s yields, that length of time is cut to 1.2 years.
Rates can still rise from here, and bond prices can still fall, but investors now have considerably more income working in the other direction.
A decline in a bond’s price does not tell you what the investor ultimately earned. The clearest way to see that is to separate price from total return over a long stretch.
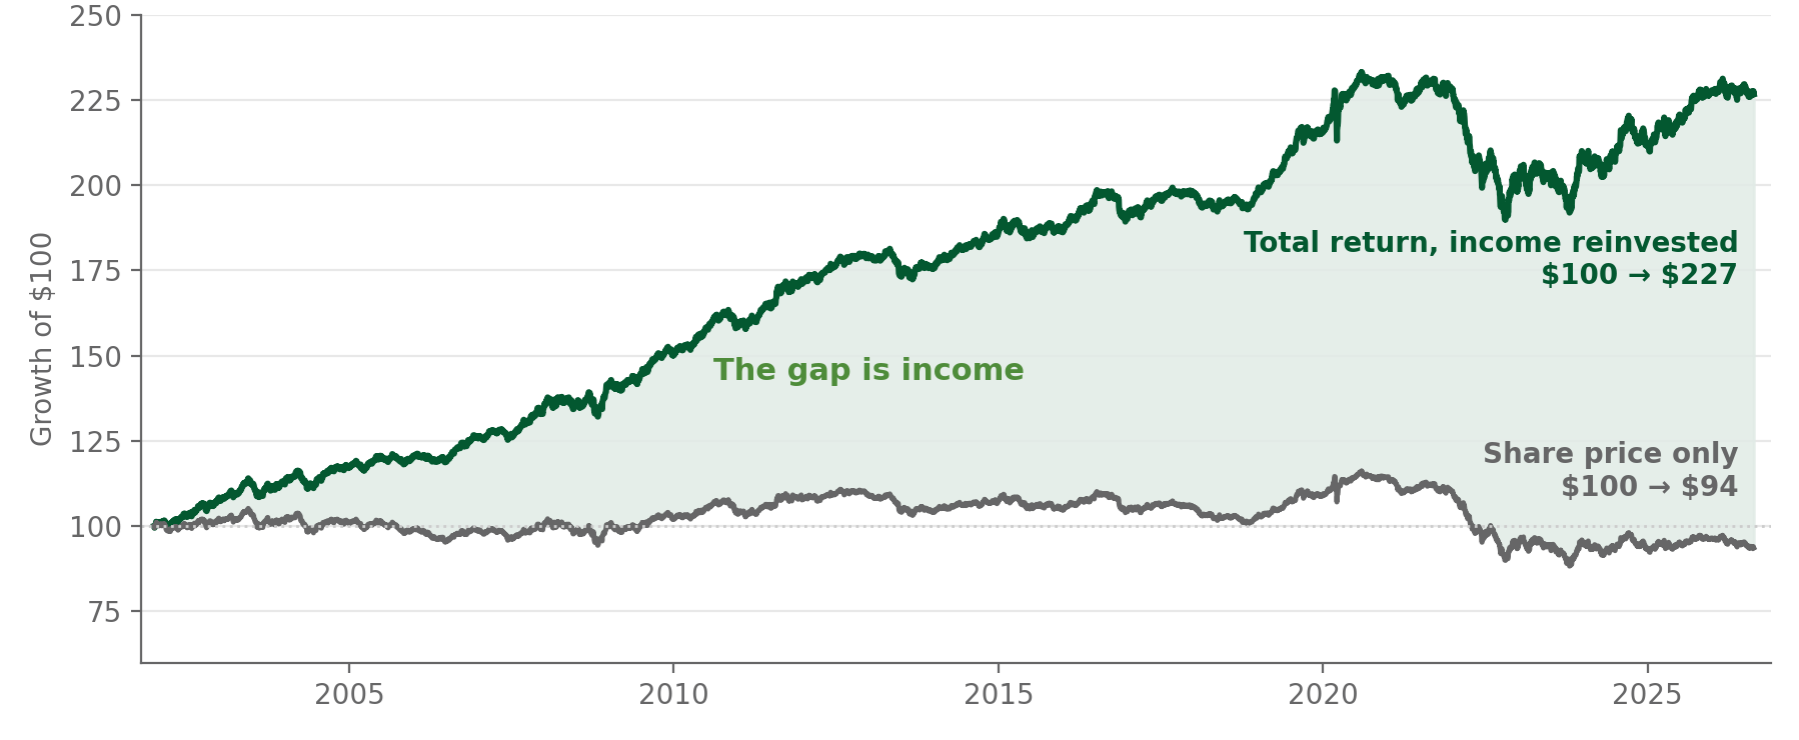
Source: Vanguard Total Bond Market Index Fund, December 2001 to August 2026. The grey line is the share price alone. The green line adds reinvested income. See Note 6.
Over roughly 25 years, the Vanguard Total Bond Market Index Fund’s share price fell from $100 to $94 on an indexed basis. It rose, it fell, and ultimately declined 24% from its 2020 high. But with income reinvested, that same $100 grew to $227, a total return of 3.4% a year. The difference was the income paid, reinvested, and compounded along the way.
The same pattern shows up across a much longer history. Since 1928, 10-year Treasuries produced a loss in 20 of 98 one-year periods, more than most assume. Extend the holding period to 5 years and losses occurred in just 5 of 94 rolling periods. Across 89 rolling 10-year periods, there were none.
This illustrates why time matters for bonds. As the holding period lengthens, more income is collected and reinvested, while any single change in market price becomes a smaller part of the overall result.
Government debt, corporate borrowing, and inflation concerns do not need to disappear for bonds to do their job in a portfolio.
Stocks have historically earned more than bonds over long periods, and investors should expect a higher return for taking stock market risk. Bonds are not there to compete with that. Bonds are there to narrow the range of what can happen.
The difference is easiest to see when markets are at their worst. Bonds have experienced some painful periods, but historically those losses have been much smaller than the worst stock market declines.
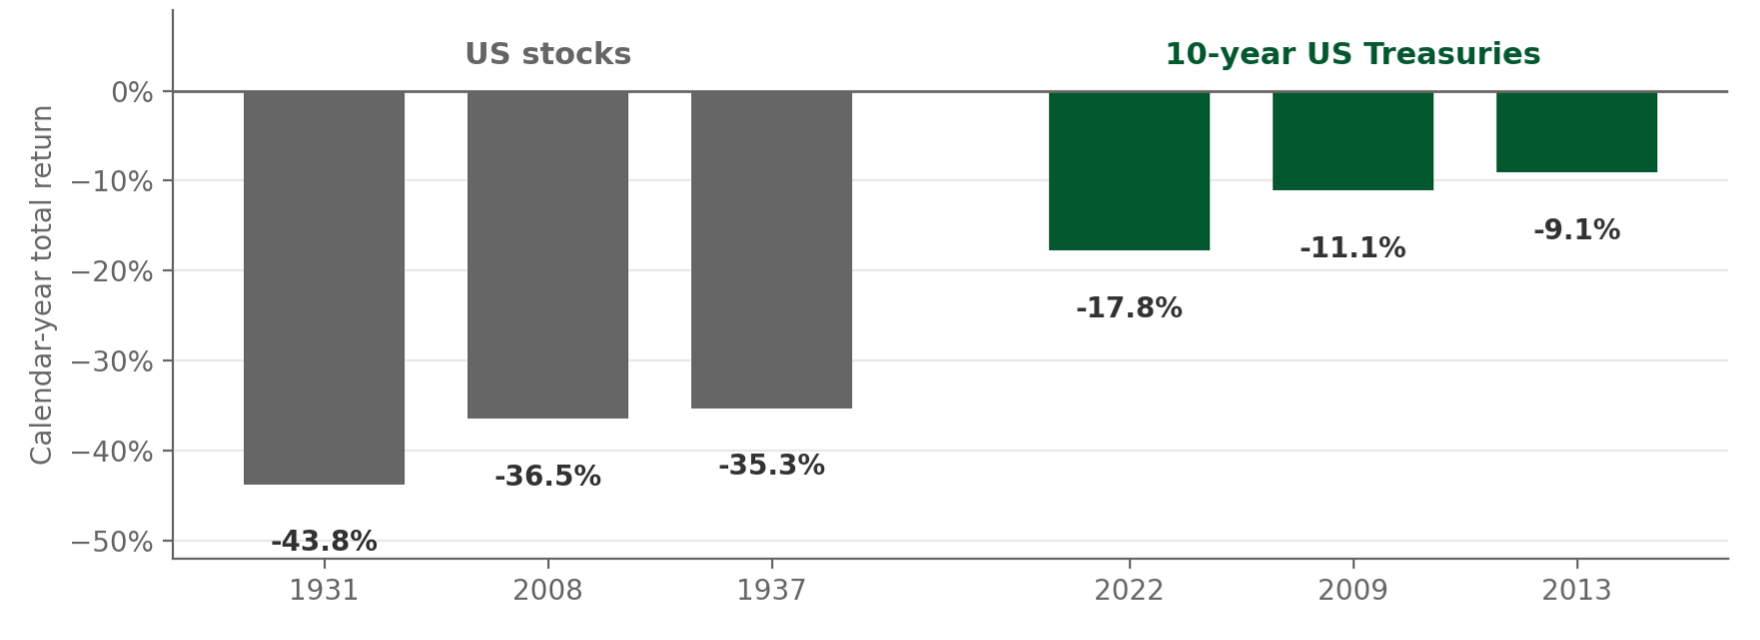
Source and methodology: Damodaran dataset, 1928 to 2025. See Note 7.
Combining bonds with stocks narrows the range of outcomes. Since 1928, moving from all stocks to a 60/40 stock/bond portfolio reduced rolling 10-year outcome ranges by about a third. The tradeoff was lower returns.
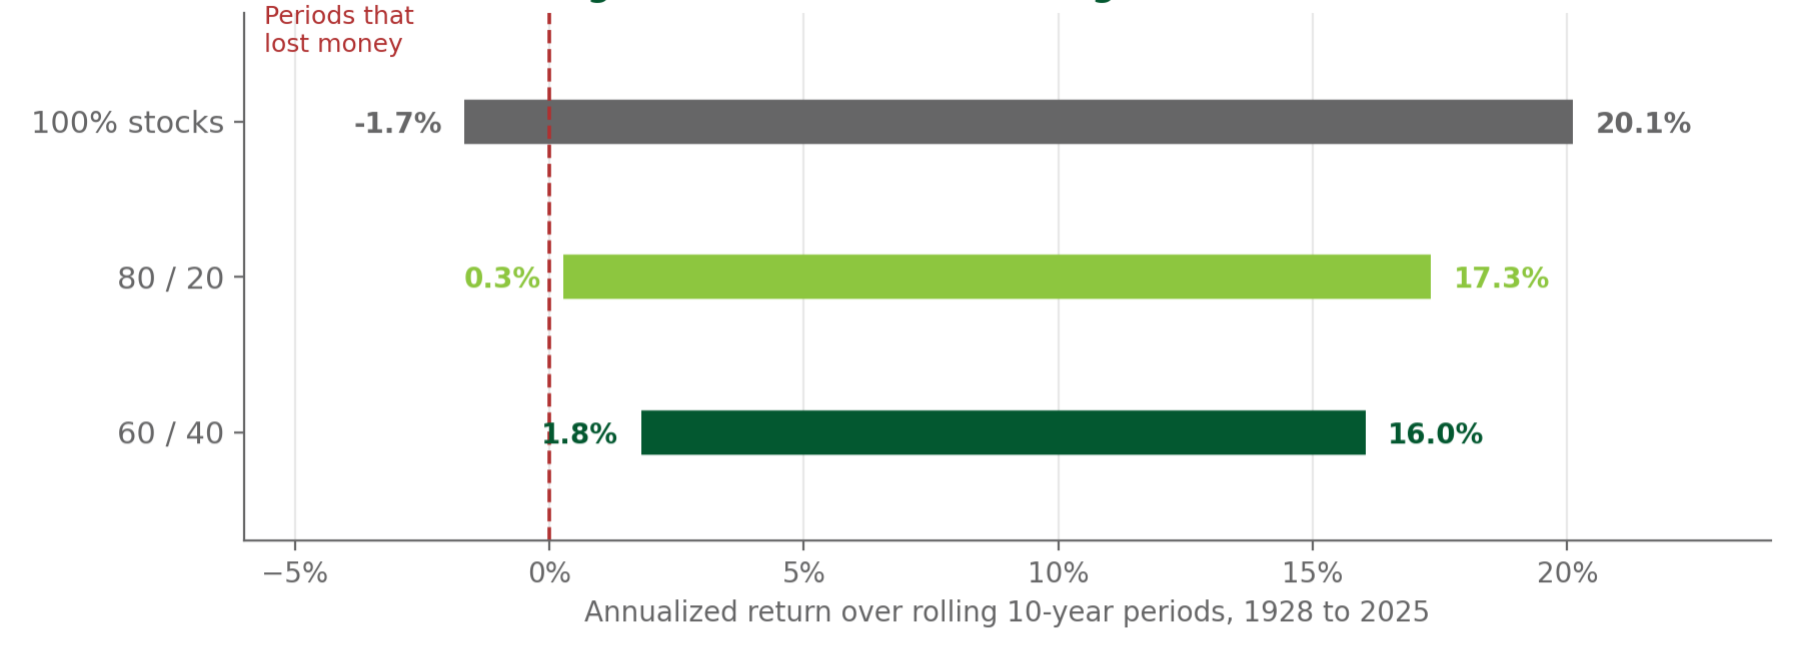
Source and methodology: Best and worst annualized results across every rolling 10-year period since 1928, for three portfolio mixes, rebalanced annually. See Note 8.
That tradeoff has a purpose. The goal is not to maximize the return of every holding for most families. It is to build a portfolio capable of funding real-life obligations across a wider range of market outcomes.
Some investors worry that bonds lose their diversification value when stock and bond prices increasingly move in the same direction. Moving in opposite directions helps, but it is not required.
Bonds have historically moved around much less than stocks. Adding a less volatile investment can still reduce a portfolio’s overall swings even when the two sometimes move in the same direction.
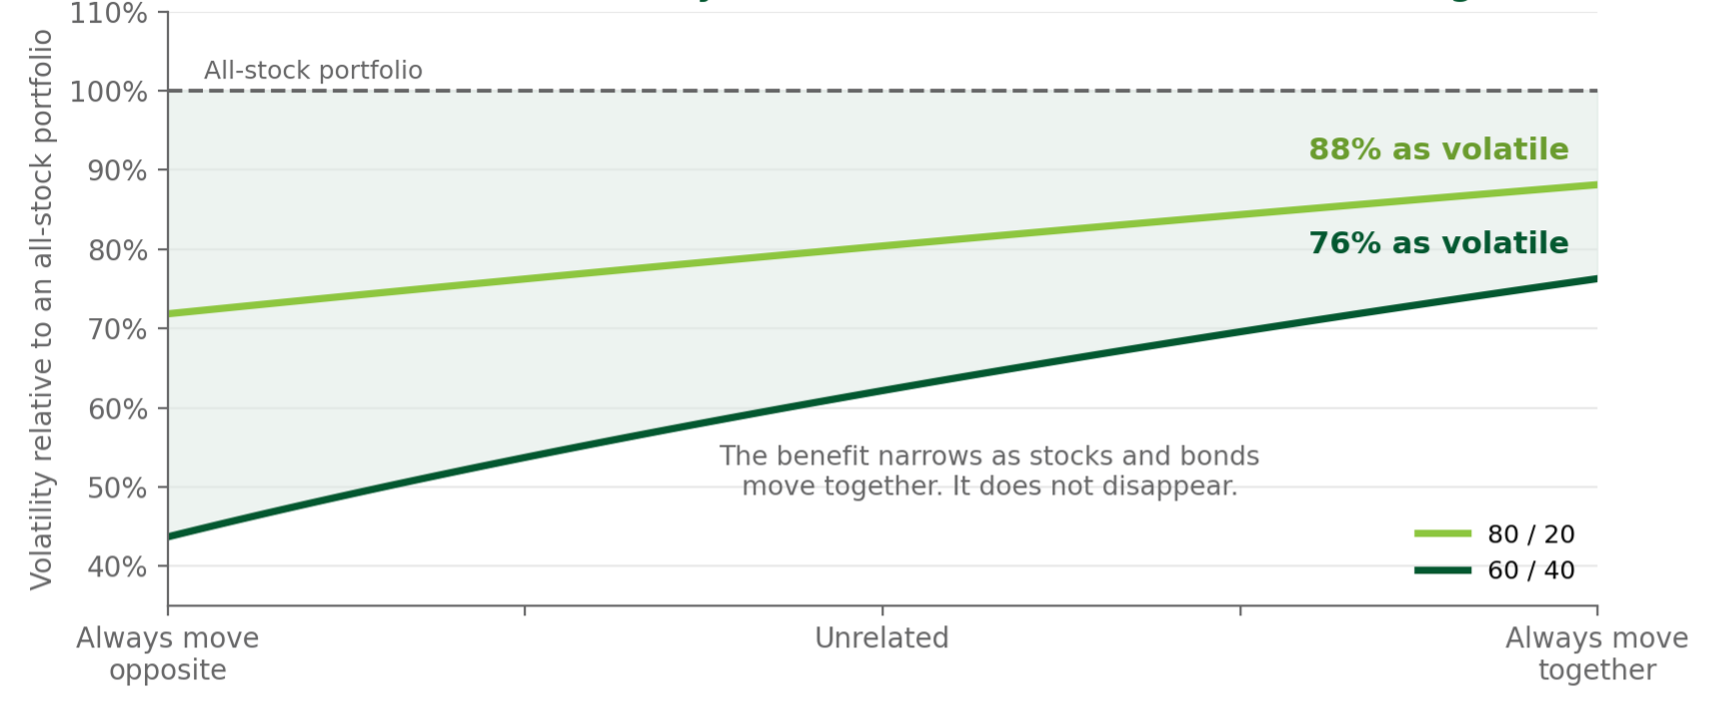
Sources and methodology: Volatility of mixed portfolios relative to an all-stock portfolio, across the full range of possible relationships between stock and bond returns, using full-period volatility assumptions. See Note 7 and Note 9.
The closer stocks and bonds move together, the smaller the diversification benefit becomes, but the benefit does not simply disappear when correlation turns positive.
2022 was an extreme example. Stocks fell 18.0%, and 10-year Treasuries fell 17.8%, making it one of the weakest years ever on record for a traditional stock/bond portfolio, heavily influenced by low starting yields.
Today’s starting point is different. That does not prevent another year when stocks and bonds fall together. It means bond investors begin with considerably more income working in their favor if they do.
Match the horizon
Bond price volatility matters most when the money is needed before the investment has had time to work. A portfolio with 6 years of interest-rate duration is a poor match for money needed next year, regardless of how attractive its yield may be.
The timeline of the investment should match the timeline of the plan.
Size bonds to the job
More bonds generally mean a narrower range of portfolio outcomes, but also a lower expected return. The right amount depends on when the money is needed and how much variability the plan can absorb.
That is a planning decision, not a prediction about the bond market.
Let the starting yield work
Investors begin today with considerably more income than they did five years ago. That does not remove the risks discussed in this paper. Government borrowing can keep rising. Companies can take on more debt. Inflation can surprise again. Rates can move higher.
The difference is that bond investors are being paid considerably more to take those risks today.
Bonds do not require a calm world to do their job. Their role is not to predict interest rates or compete with stocks. It is to provide income, help fund future obligations, and narrow the range of outcomes a portfolio can experience.
What that should mean for any portfolio depends on the investor, the timeline, and the plan.
Notes & Sources
Market data is as of 20 August 2026 unless otherwise stated. Figures are rounded. This paper is periodically updated; figures reflect the date shown. Each exhibit in the paper carries a reference to the numbered note below that documents its source and method.
1 Starting yield and subsequent returns
Computed from the long-run dataset maintained by Robert Shiller, Yale University, monthly from January 1871. Method: a cumulative total return index was built by compounding Shiller’s monthly bond total return factors. For each month the annualized return over the following 120 months was computed from that index. Two predictors are tested against that forward return. The first is the annualized return over the prior 120 months. The second is the 10-year yield in the starting month. Requiring 10 years of history and 10 years of forward data gives 1,628 overlapping monthly observations with start dates from January 1881 through August 2016. The prior decade’s return explains 24.0% of the variation in the next decade’s return; the starting yield explains 91.4%. A two-variable fit using both explains 92.4%. The prior decade’s return correlates with the starting yield at 0.41, which is why it carries any signal at all. Fitted on starting yield alone, the relationship is return = minus 0.57 plus 1.14 times yield. Applying it to a 4.69% starting yield gives 4.80%. Across the 106 observations with starting yields between 4.4% and 5.0%, the average subsequent return was 4.96%, the minimum 2.41%, with no negative outcomes. The trailing 10-year return through August 2026 is 0.05% a year and the trailing five-year return is negative 2.30% a year. Observations overlap by 119 of 120 months and are therefore not statistically independent. The series is a constant maturity Treasury proxy in nominal terms, not a bond fund, and reflects no fees, taxes, credit risk or trading costs.
2 Window sensitivity
The same regression run on shorter windows produces different slopes. From 1871 to 1980 the implied return at a 4.69% starting yield is 4.81%; from 1981 to 2016 it is 4.96%; from 1999 to 2016 it is 5.33%. The period since 1999 is dominated by a sustained decline in interest rates, which raises realized returns above starting yields. Full history is used here for that reason.
3 Treasury yields and the yield curve
US Treasury constant-maturity yields via YCharts. At 20 August 2026: 3-month 3.87%, 2-year 4.19%, 5-year 4.39%, 10-year 4.69%, 20-year 5.20%, 30-year 5.23%. At 20 August 2021, five years earlier to the day: 3-month 0.05%, 2-year 0.23%, 5-year 0.80%, 10-year 1.26%, 20-year 1.79%, 30-year 1.87%. At 31 December 2021, the reference point for statements about conditions heading into 2022: 3-month 0.05%, 2-year 0.73%, 5-year 1.27%, 10-year 1.52%, 20-year 1.97%, 30-year 1.93%. The 30-year reached 5.33% on 18 August 2026, its highest since June 2007. The 20-year bond was reintroduced in May 2020, so it exists on all three dates.
4 Long history of the 10-year yield
Shiller dataset, 1,868 monthly observations from January 1871 through August 2026. Median 3.84%. Era averages: 1871 to 1899, 3.95%; 1900 to 1949, 3.39%; 1950 to 1979, 5.07%; 1980 to 1999, 8.63%; 2000 to 2009, 4.46%; 2010 to 2021, 2.20%. Low of 0.62% in July 2020; high of 15.32% in September 1981. Today’s reading sits at approximately the 72nd percentile of all months in the series.
5 Rate cushion and recovery time
One year of income offsets a rate rise of approximately the yield divided by duration. This is a first order approximation that ignores convexity and assumes a single parallel shift in the yield curve. Current figures use two broad market benchmarks, with yields and durations from YCharts as of 20 August 2026. The taxable market is represented by the Vanguard Total Bond Market ETF (BND), 30-day SEC yield 4.66% and effective duration 5.8 years, giving approximately 80 basis points. The tax-exempt market is represented by the Vanguard Tax-Exempt Bond ETF (VTEB), 30-day SEC yield 3.67% and effective duration 7.0 years, giving approximately 52 basis points. These funds are used as investable proxies for their markets and are not recommendations. The pre-2022 figures are approximations for illustration, using 0.80% yield with 5 years duration for municipals and 1.20% with 6.5 years for taxable bonds. They are not index or fund data. Recovery time after a 1% rate rise on these inputs is approximately 3.4 years for taxable bonds and 3.3 years for municipals pre-2022, against 1.2 years and 1.7 years today. Recovery time assumes the higher yield is earned following the rate rise, with no subsequent change in rates.
6 Income and price return
Vanguard Total Bond Market Index Fund Admiral (VBTLX) via YCharts, daily from 31 December 2001 to 21 August 2026, 24.6 years. Share price fell from $10.15 to $9.50, an annualized price return of negative 0.27%. Total return with distributions reinvested was 3.38% a year, so $100 became $227. Largest peak-to-trough decline in share price was 24.0%, from August 2020 to October 2023. Across all rolling one-year windows in the period, share price was negative in 46% and total return in 19%. VBTLX is used as a broad taxable bond market proxy and is not a recommendation. Holding-period figures for 10-year Treasuries are from the Damodaran dataset, 1928 to 2025: negative in 20 of 98 one-year periods, 5 of 94 rolling five-year periods and none of 89 rolling 10-year periods. These are historical observations for a single Treasury return series and are not a property of bonds or bond funds generally.
7 Worst calendar years
Damodaran dataset, 1928 to 2025. Three weakest calendar years for the S&P 500: 1931 at negative 43.84%, 2008 at negative 36.55%, 1937 at negative 35.34%. Three weakest for 10-year US Treasuries: 2022 at negative 17.83%, 2009 at negative 11.13%, 2013 at negative 9.10%. Stocks were negative in 26 of 98 years and 10-year Treasuries in 20 of 98. The longest run of consecutive negative years for Treasuries is two.
8 Portfolio mixes and range of outcomes
Computed from the annual dataset maintained by Aswath Damodaran, NYU Stern, 1928 through 2025, using S&P 500 and 10-year US Treasury total returns with annual rebalancing, before fees and taxes. Full-period compound annual returns: all-stock 10.02%, 80/20 9.27%, 60/40 8.34%, all bond 4.53%. Rolling 10-year annualized results: all-stock ranged from negative 1.7% to 20.1% with 5 negative periods across 89 overlapping windows; 60/40 ranged from 1.8% to 16.0% with none.
9 Stock and bond correlation
Same dataset. The correlation of annual stock and bond returns across the full period is 0.02. Measured over rolling 10-year windows it has ranged from negative 0.86 to positive 0.74. In periods of high positive correlation a 60/40 portfolio showed 73% of the volatility of an all-stock portfolio; in periods of negative correlation, 52%. The theoretical range across all possible correlations, using full-period volatilities of 19.40% for stocks and 7.90% for bonds, runs from 44% to 76%. Years since 1928 in which both stocks and bonds declined: 1931, 1941, 1969, 2018 and 2022. In 2022 the S&P 500 returned negative 18.04% and 10-year Treasuries negative 17.83%, giving a 60/40 result of negative 17.96%.
Disclosures
Advisory services provided by TFO Wealth Partners, LLC. This material is for informational and educational purposes only. It does not constitute investment, tax or legal advice, nor a recommendation to buy or sell any security, and it does not take into account the objectives, financial situation or needs of any individual.
Past performance is not indicative of future results. No current or prospective client should assume that future performance of any specific investment or strategy will be profitable or equal to past performance levels. All investment strategies carry the potential for profit or loss. Different types of investments involve varying degrees of risk, and there can be no assurance that any specific investment will be suitable or profitable for a client’s portfolio. There is no assurance that a portfolio will match or outperform any particular benchmark.
Bonds are subject to interest rate risk, credit risk, inflation risk, liquidity risk and, for municipal securities, risks arising from changes in tax law. Rising interest rates reduce the market value of outstanding bonds. Diversification and asset allocation do not guarantee a profit or protect against loss in a declining market.
Indices and index funds referenced are unmanaged, do not reflect fees or expenses, and are not available for direct investment. Any funds named are used solely as broad market proxies for illustration. Historical figures are compiled from third party sources believed to be reliable, but accuracy and completeness are not guaranteed. Hypothetical portfolio mixes are illustrative only, assume annual rebalancing, and reflect no advisory fees, transaction costs or taxes; actual results would be lower.
Statements regarding market conditions and economic developments reflect views as of the date shown and are subject to change without notice. Nothing in this paper should be read as a forecast of future events, market levels or investment results.
Indices are displayed as broad sample representations of certain sectors of the market and are for reference point only and may not be directly comparable to any specific portfolio. Indices are not available for direct investment. Their performance does not reflect the expenses associated with the management of an actual portfolio nor do indexes represent the results of actual trading. Historical performance results do not reflect the deduction of transaction and/or custodial charges or the deduction of an investment management fee, the incurrence of which would decrease historical performance results. There are no assurances that a portfolio will match or exceed any particular index or benchmark.
572WP -2026.09