

Worth Noting: All-Time Highs Are Not a Warning Sign
Worth_Noting_Web_August2026
Articles

Worth Noting: All-Time Highs Are Not a Warning Sign

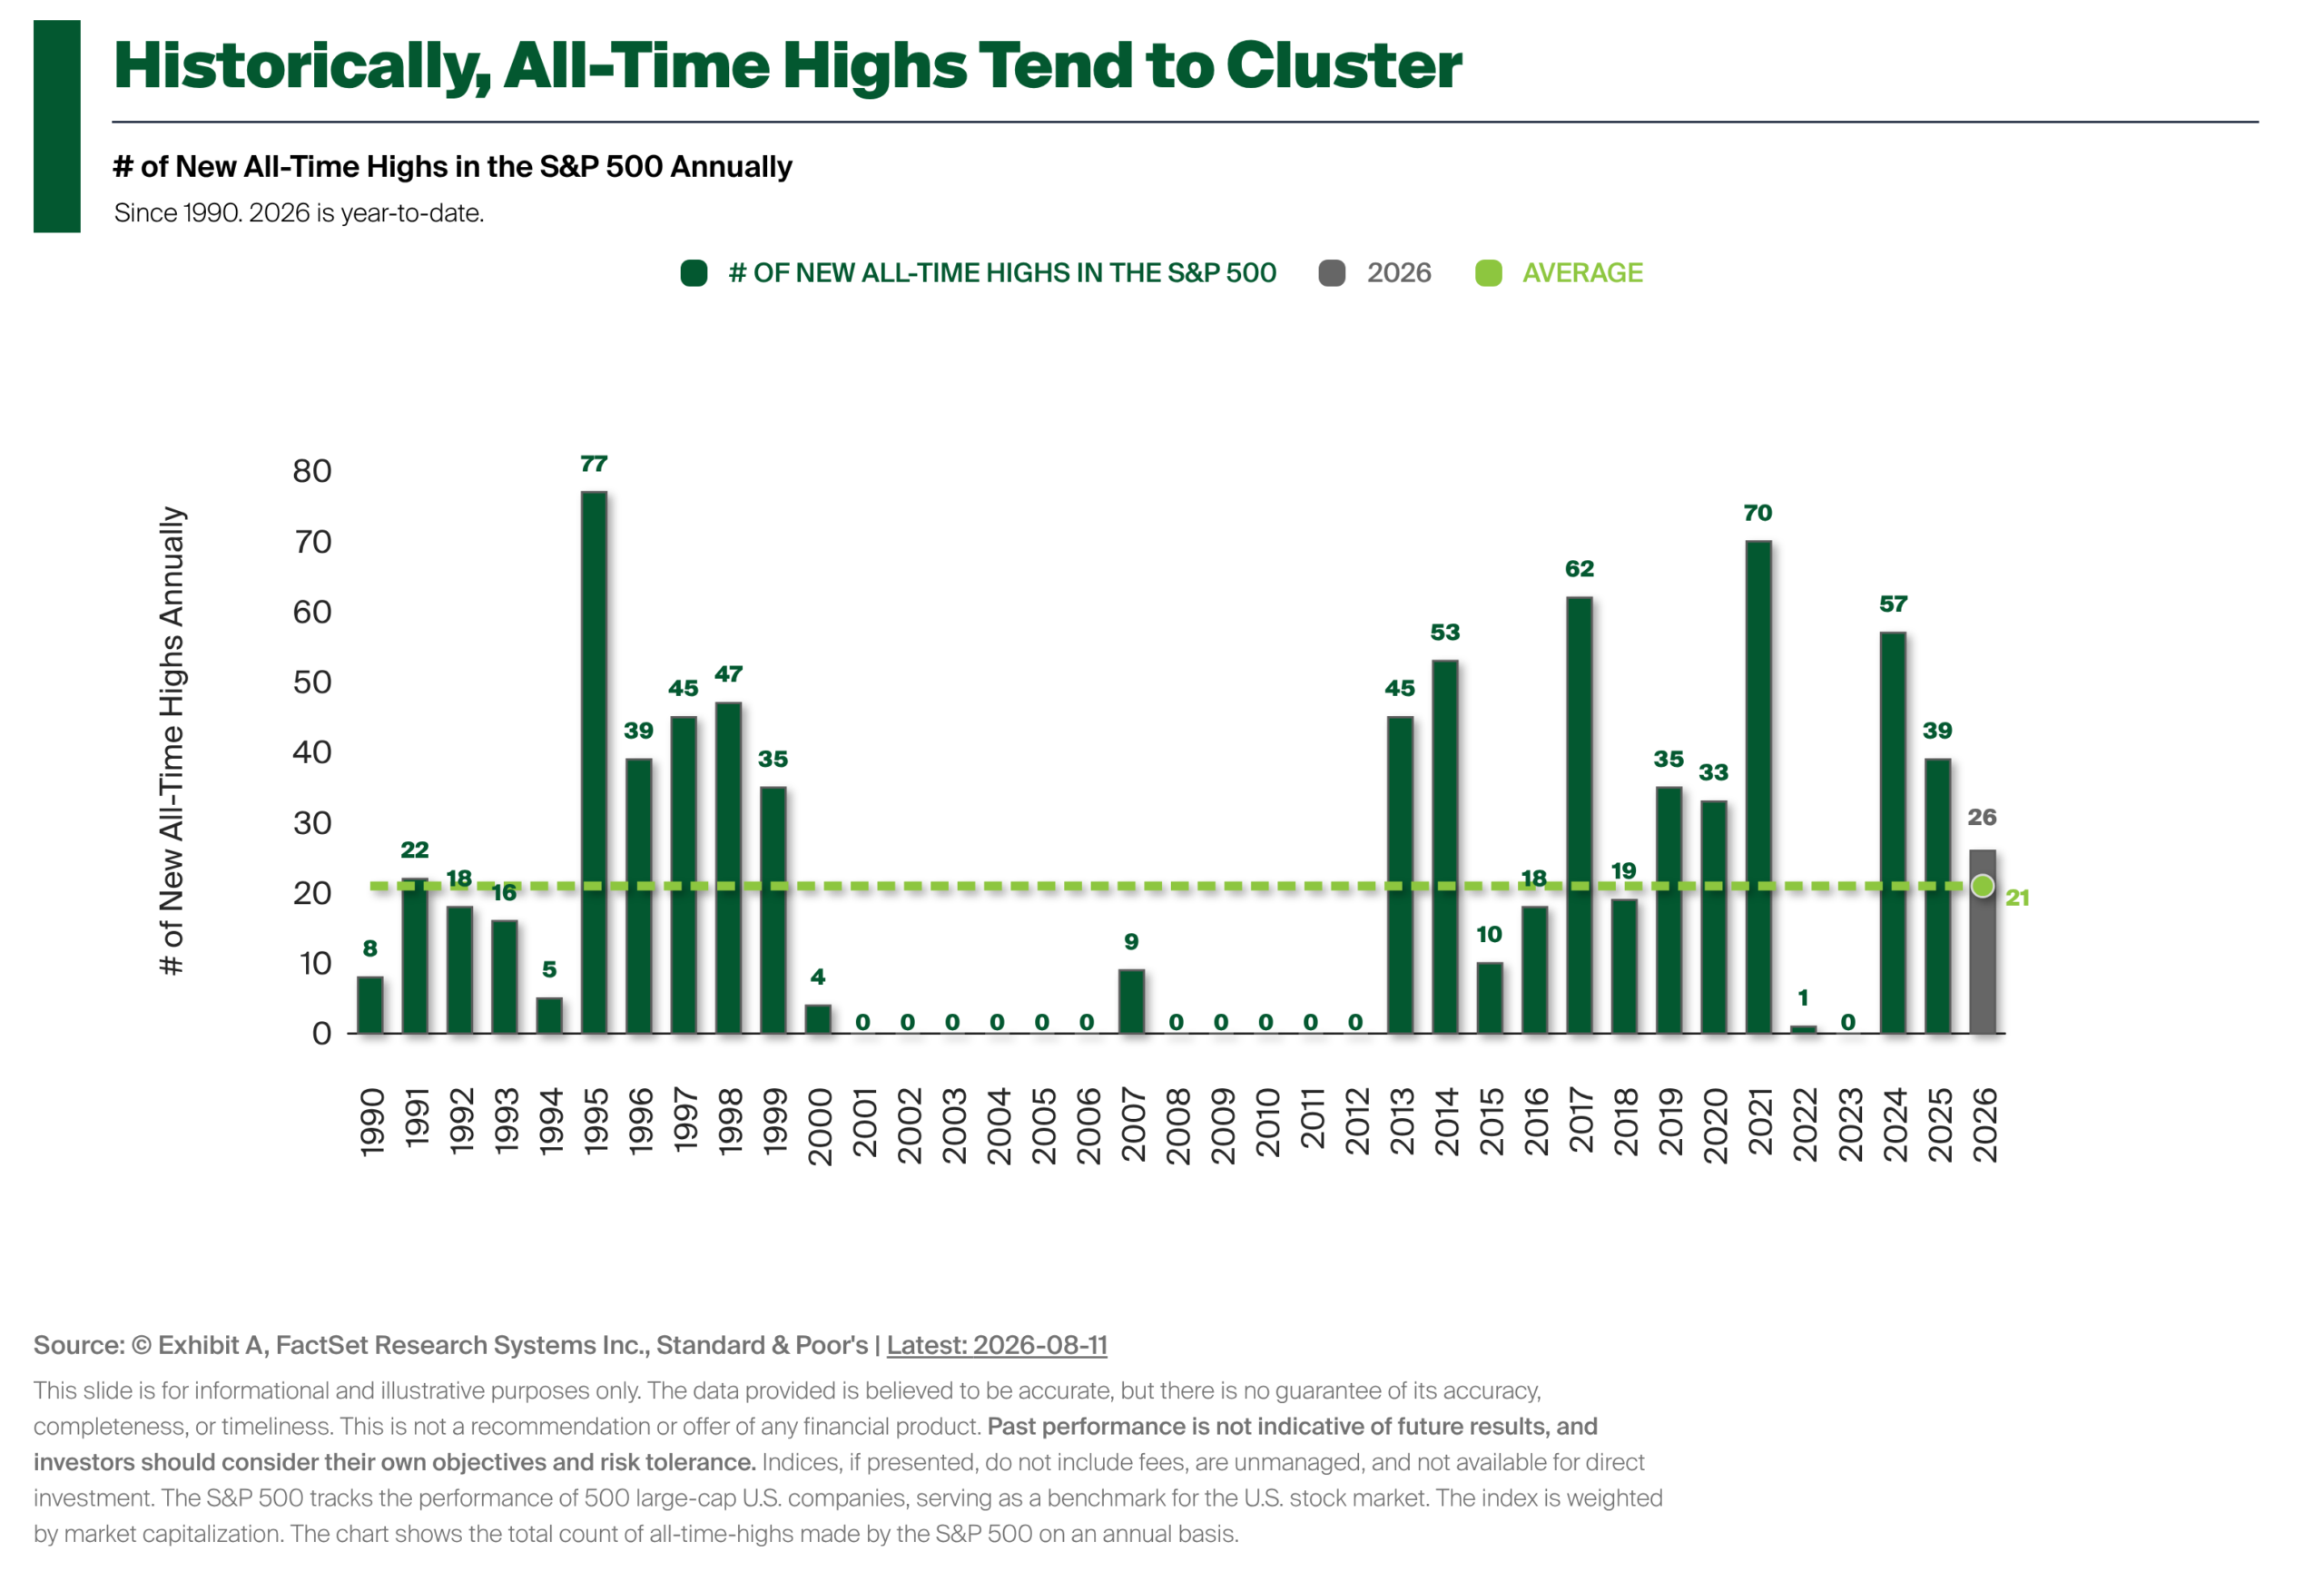
On August 7, the S&P 500 closed at a new all-time high, its 26th of the year and its first since June 2. Records like this often bring the same warning: the market is stretched, a pullback is coming, and now is the wrong time to invest.

That reaction is understandable. No one wants to invest at what later looks like “the top.” But a record high, by itself, tells us very little about what comes next.

A better starting point is why stocks reach new highs in the first place. A share of stock represents ownership in a business, and business values can rise when companies innovate, expand, find new customers, and convert revenue growth into higher profits.

Stock returns come from earnings growth, dividends, and changes in valuations, or what investors are willing to pay per dollar of earnings. Over long periods, earnings tend to do most of the work. So, when the market reaches another high, the key question is not just whether prices are higher. It is whether profits are higher, too.

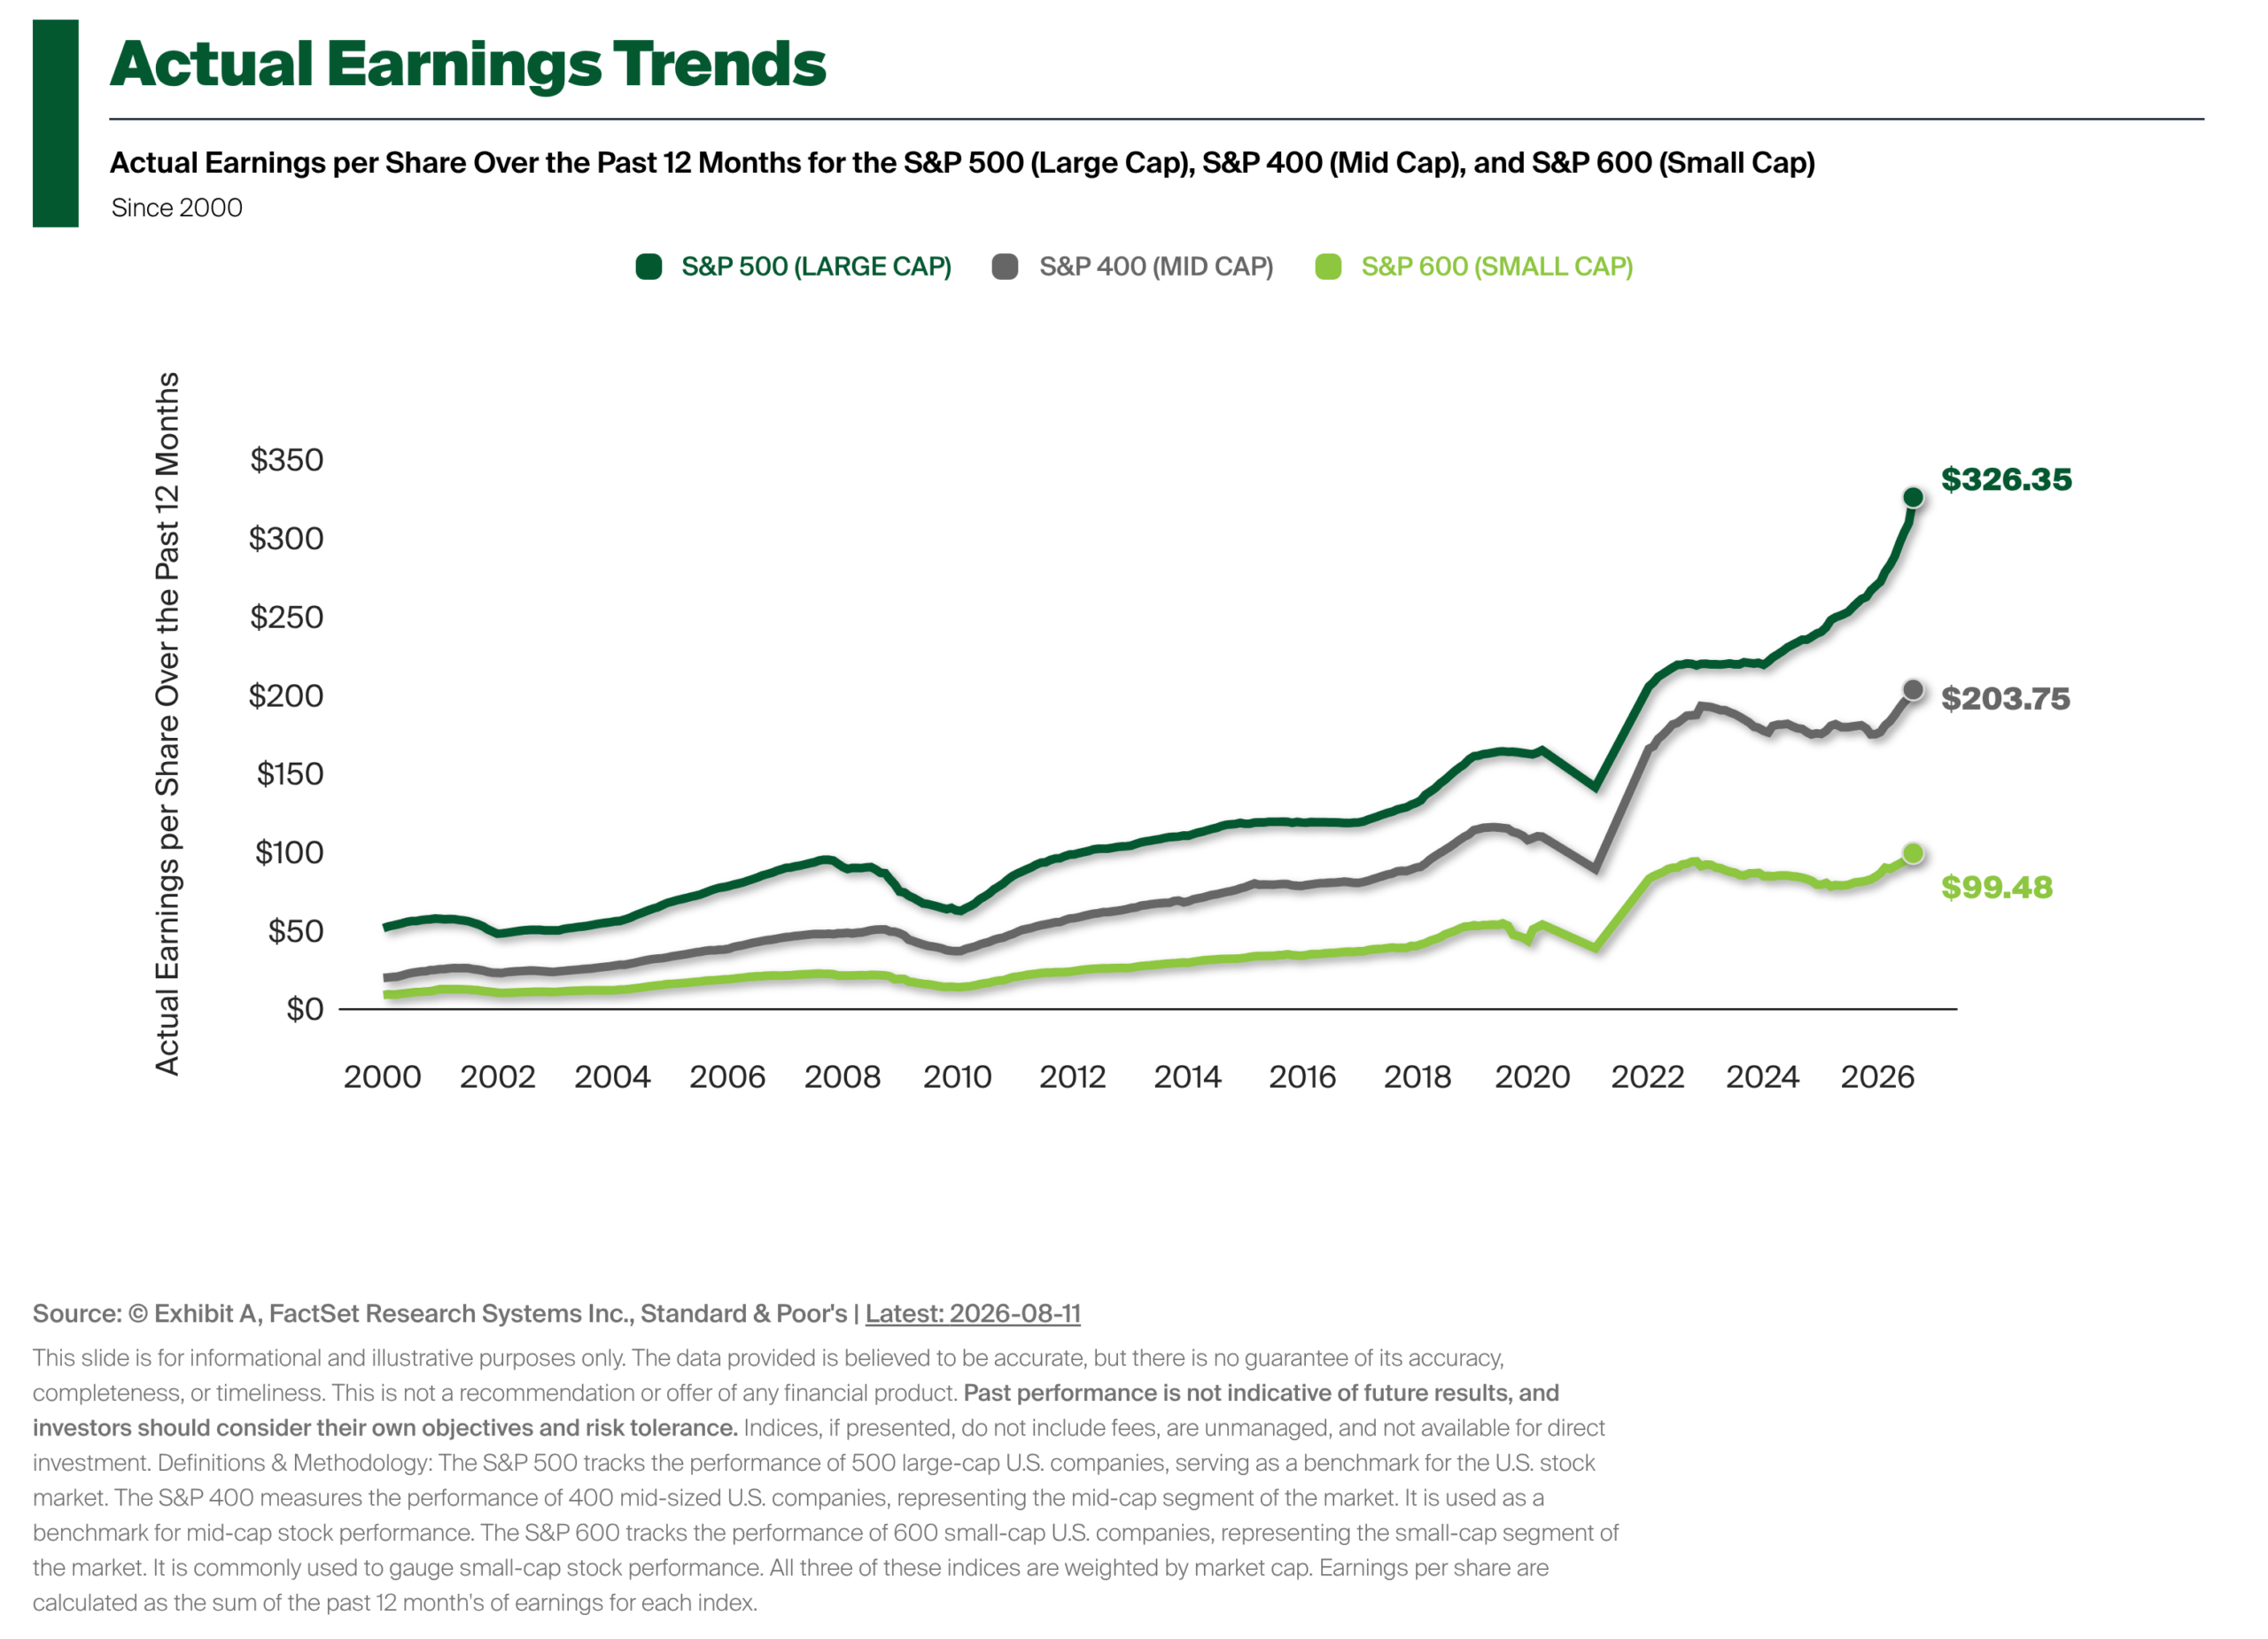
Today, the answer is yes. S&P 500 companies earned ~$326 per share over the last twelve months, also an all-time high. These are real profits from real businesses, and they are roughly three times higher than they were a decade ago.
This matters because market highs can come from different sources. A market driven mainly by expanding valuations deserves more caution. A market supported by rising profits is usually on firmer footing.

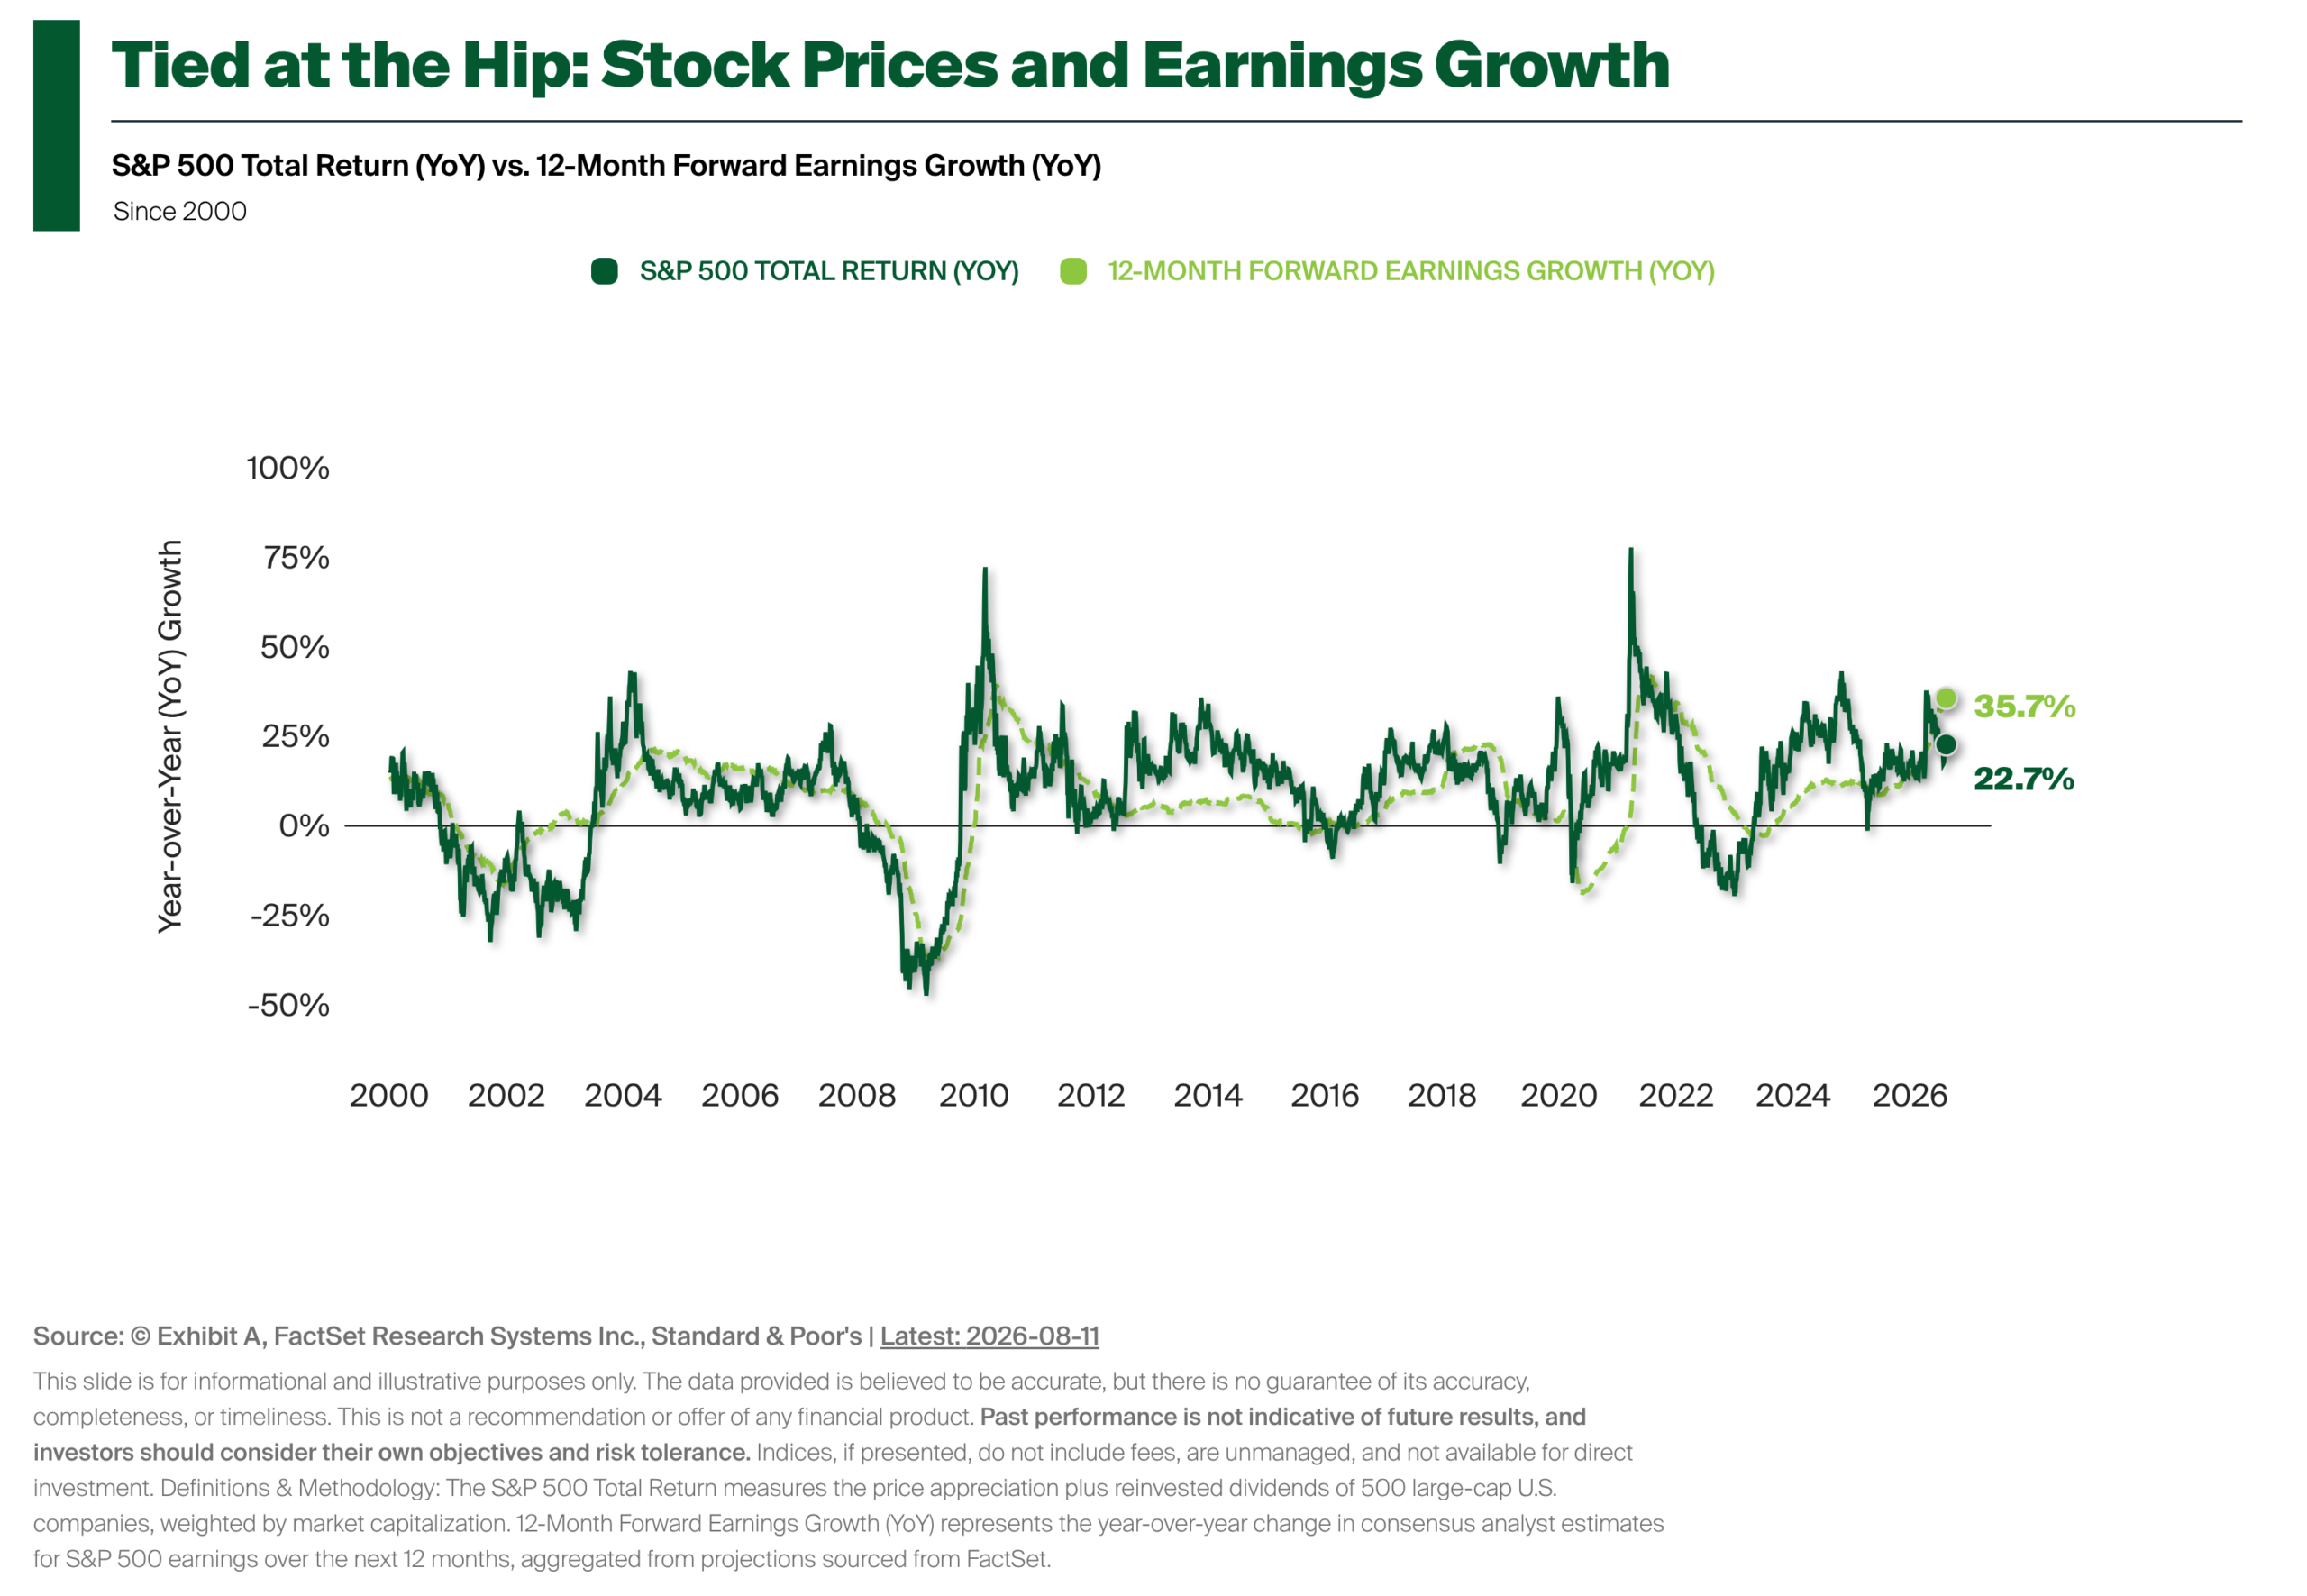
In any single year, prices can move ahead of or behind earnings as investor sentiment shifts, but over longer periods, the two are more closely connected.

Over the past 12 months, the S&P 500 generated a total return of about 23%, while forward earnings rose close to 36%. Forward earnings grew faster than prices, so the market’s forward valuation multiple actually became cheaper. Not what most would expect.

The frequency of record highs is also important. Since 1990, the S&P 500 has averaged roughly 21 new highs per year, and those highs tend to arrive in clusters. The long stretches without records, from 2001 through 2006 and from 2008 through 2012, followed deep bear markets, when it took years for the index to recover prior peaks. Outside those recoveries, new highs are normal. A growing market should keep setting them.

That context matters because this decade has given investors plenty of reasons to wait, sell, or second-guess staying invested.

Since 2020 alone, investors have faced a global pandemic and sharp bear market, supply-chain disruptions, 40-year-high inflation, Russia’s invasion of Ukraine, aggressive Federal Reserve rate hikes, the 2022 bear market, one of the worst 60/40 years since the 1920s, mortgage rates moving from 3% to 8%, the failure of Silicon Valley Bank, a U.S. credit-rating downgrade, debt-ceiling standoffs, government shutdowns, Liberation Day tariffs, war with Iran, and repeated recession forecasts.

Yet from the start of 2020 through this year’s August 7th close, the S&P 500 set 226 new all-time highs and returned 165% with dividends reinvested, annualized 15.9% per year. A $100,000 investment would have grown to approximately $265,000.1

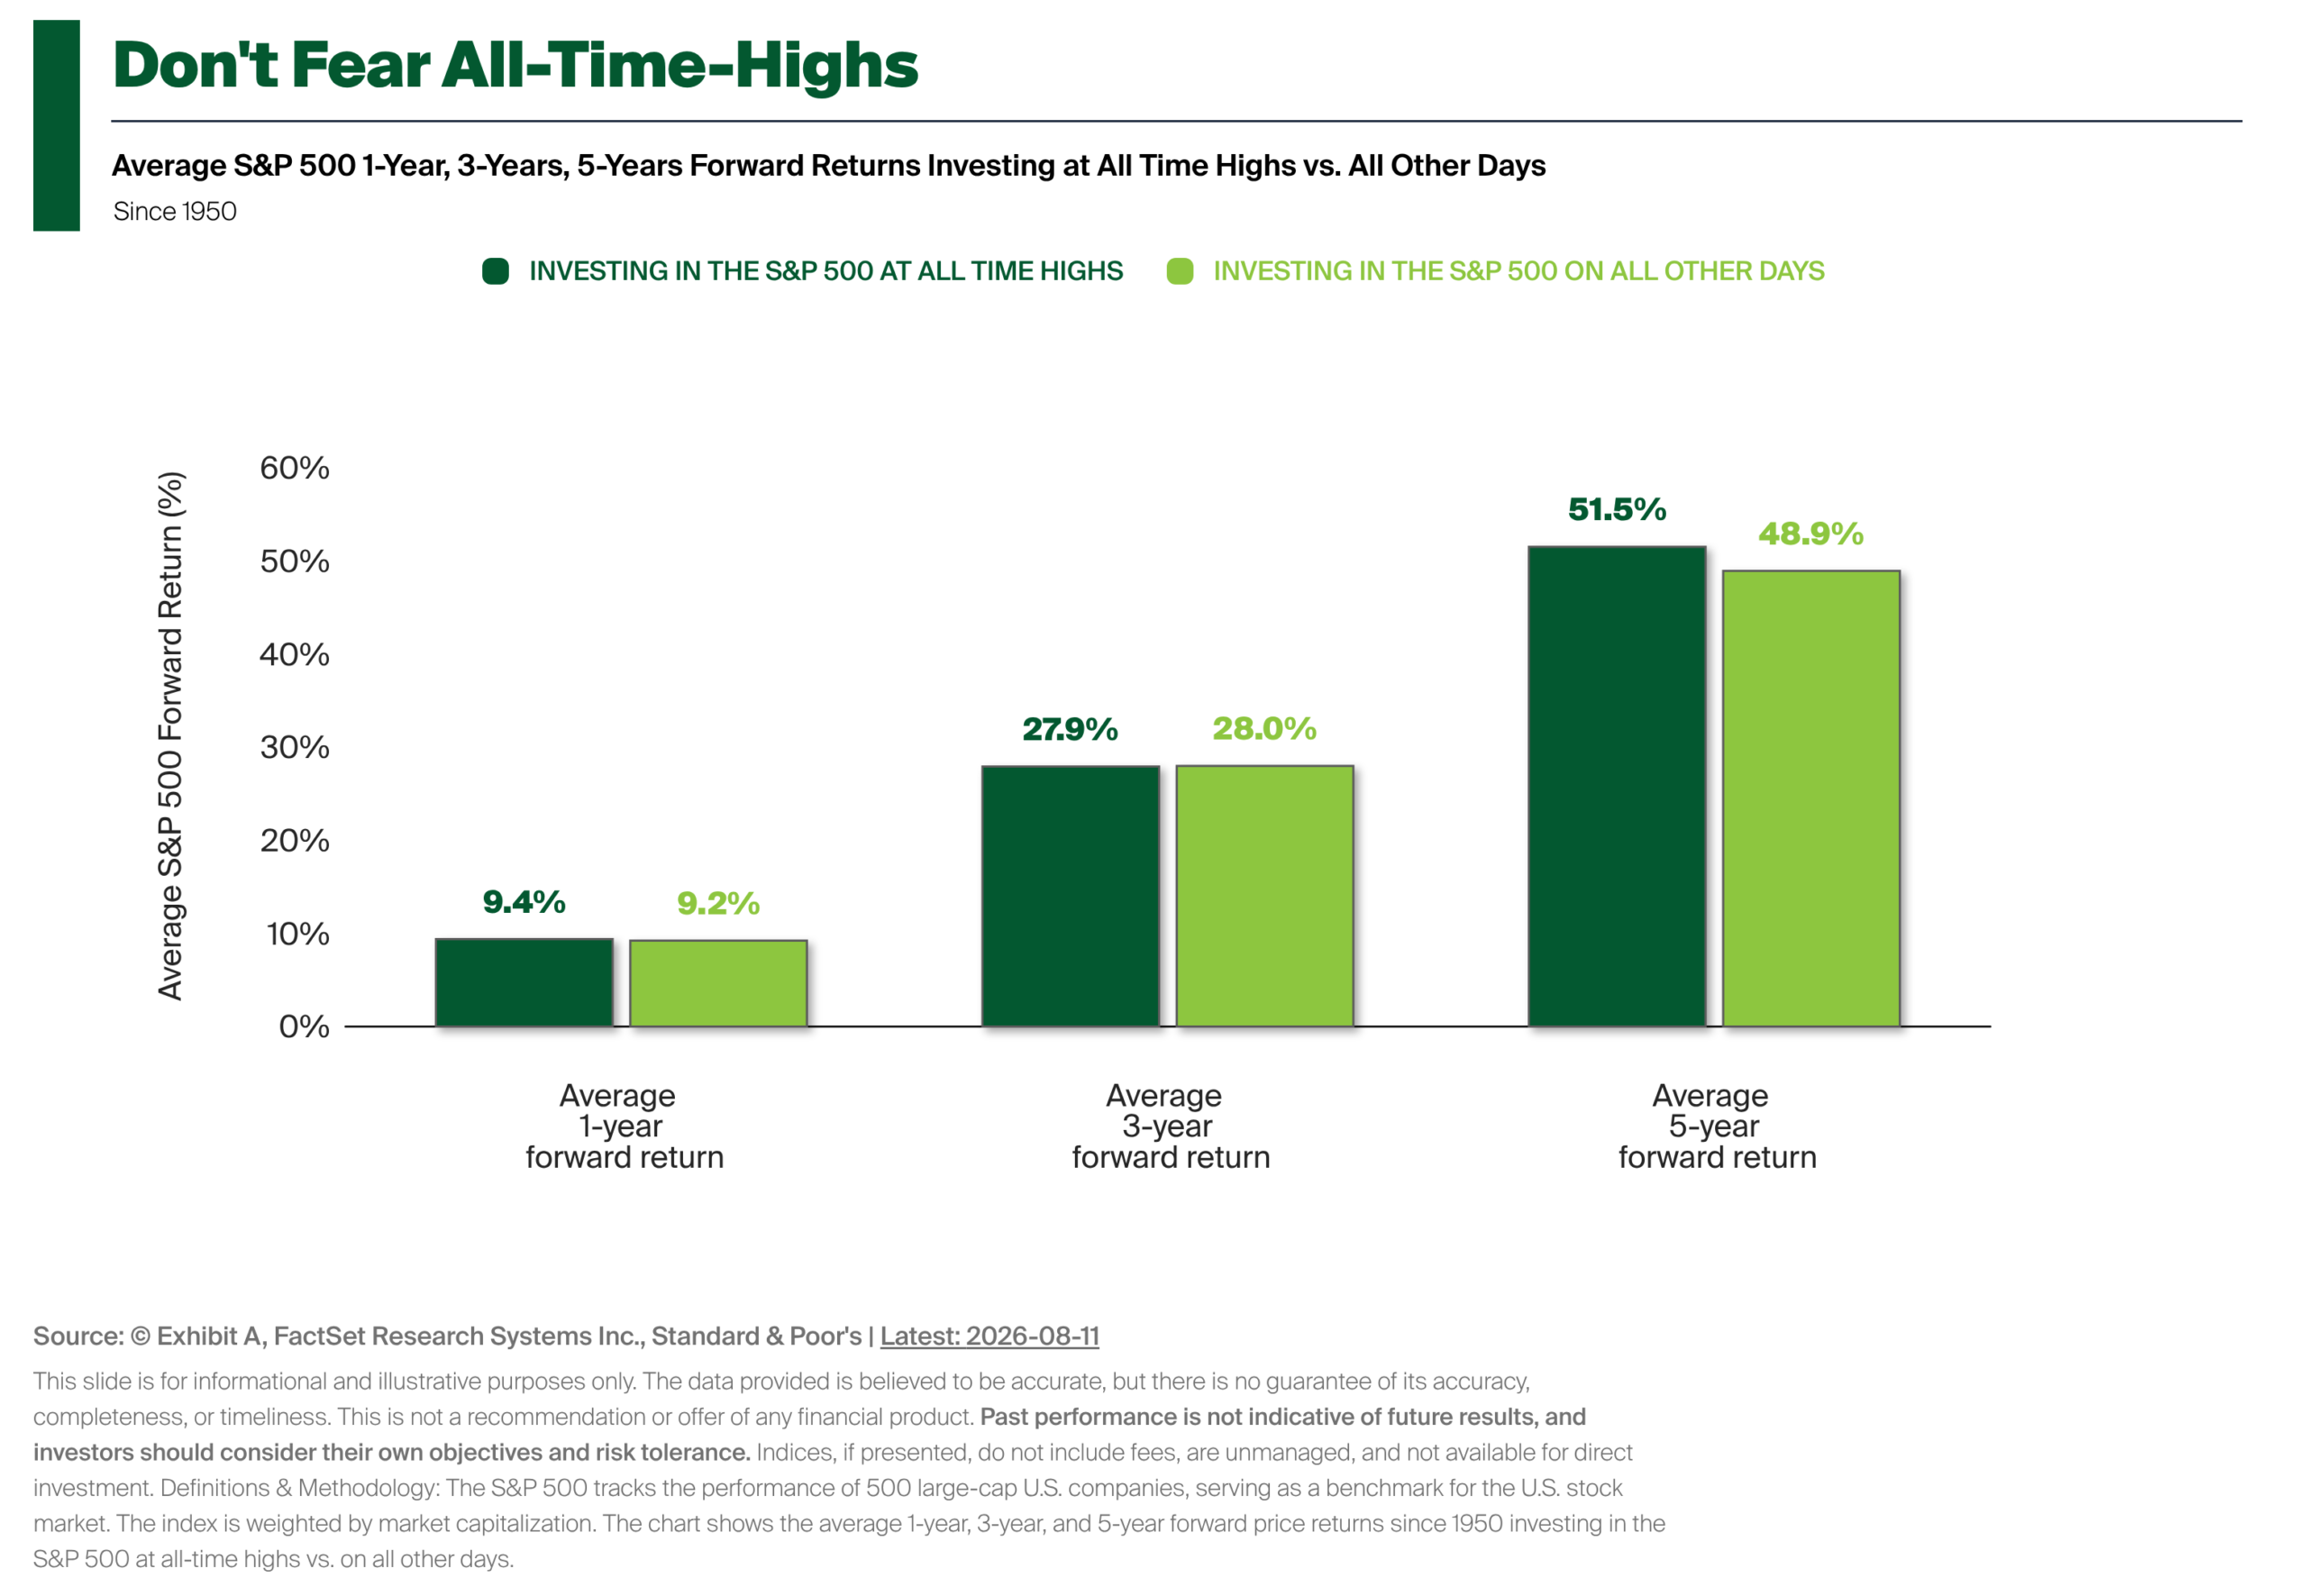
Historically, investing at all-time highs has not lowered the odds of success. One- and three-year results have been essentially the same for purchases made at highs versus all other days. Over five-year periods, purchases made at highs have produced better average results.

None of this means the market cannot fall from here. Neither stock prices nor earnings move in straight lines, and when prices fall, new records naturally become less common.

But over longer periods, markets are more rational than they often appear. All-time highs are not, by themselves, a warning sign. More often, they confirm that companies, the economy, and markets continue to grow.

1 Source: YCharts. S&P 500 Total Return Index, 12/31/2019 through 8/7/2026.

Advisory services provided by TFO Wealth Partners, LLC. This is being provided for informational purposes only, does not constitute investment advice. TFO Wealth Partners, LLC does not provide any guarantee, express or implied, that the information presented is accurate or timely, and does not contain inadvertent technical or factual inaccuracies.Past performance may not be indicative of future results. Therefore, no current or prospective client should assume that the future performance of any specific investment or strategy will be profitable or equal to past performance levels. All investment strategies have the potential for profit or loss. Different types of investments involve varying degrees of risk, and there can be no assurance that any specific investment will either be suitable or profitable for a client’s portfolio. There are no assurances that a portfolio will match or outperform any particular benchmark.

Indices are displayed as broad sample representations of certain sectors of the market and are for reference point only and may not be directly comparable to any specific portfolio. Indices are not available for direct investment. Their performance does not reflect the expenses associated with the management of an actual portfolio nor do indexes represent the results of actual trading. Historical performance results do not reflect the deduction of transaction and/or custodial charges or the deduction of an investment management fee, the incurrence of which would decrease historical performance results. There are no assurances that a portfolio will match or exceed any particular index or benchmark.

557cWP – 2026.08

white-dots white-dots

Ready to review your current wealth plan?

Getting started is easy. Set a time to talk.

Let’s Talkarrowarrow