Numbers and Narratives: Q3 2026
Quarterly_Update_Cover_Q3_2026
Video

Numbers and Narratives: Q3 2026

This quarterly series is designed to provide perspective and keep you informed on global markets and economic conditions. Like previous quarters, this update is paired with a short video, so you can engage with the content in the way that works best for you.

What Changed This Quarter

Headlines:

  • “Dow, S&P 500 close at record on AI-linked earnings” – Reuters (Aug)
  • “SpaceX’s $101 Billion Unlock Heaps Pressure on Battered Shares” – Bloomberg (Aug)
  • “Corporate America’s Profits Are Booming and Signal More Good Times Ahead” – The Wall Street Journal (Aug)
  • “Silicon Valley Escalates Warnings About Existential Risks of AI” – Bloomberg (Sept)
  • “Fed Officials Raise Interest Rates” – Bloomberg (Sept)
  • “Bond Selloff Deepens After 30-Year Yield Hits Highest Since 2004” – Bloomberg (Sept)

AI is squarely back in focus. It used to be that a few companies were getting too big. Now it’s that almost every company is involved. There’s political pushback on data centers, questions about spending, and a flood of new corporate bonds to pay for it all. Even frontier model developers are warning about existential risks.

And global central banks pivoted. Rates moved higher around the world. Inflation is sticky, the conflict in the Middle East is still pushing energy prices around, and fears over debt and deficits have only grown.

Q3 had two extremes. Large companies hit record highs on booming profits, while bonds had one of their roughest quarters in years. Both are the market pricing in its best guess of what comes next. We talk often about how risk and return are related. Bearing uncertainty is why stocks and bonds earn a premium over cash. Declines are inevitable. The best way to deal with them is to plan for them to keep happening.
The Numbers That Matter

The Markets

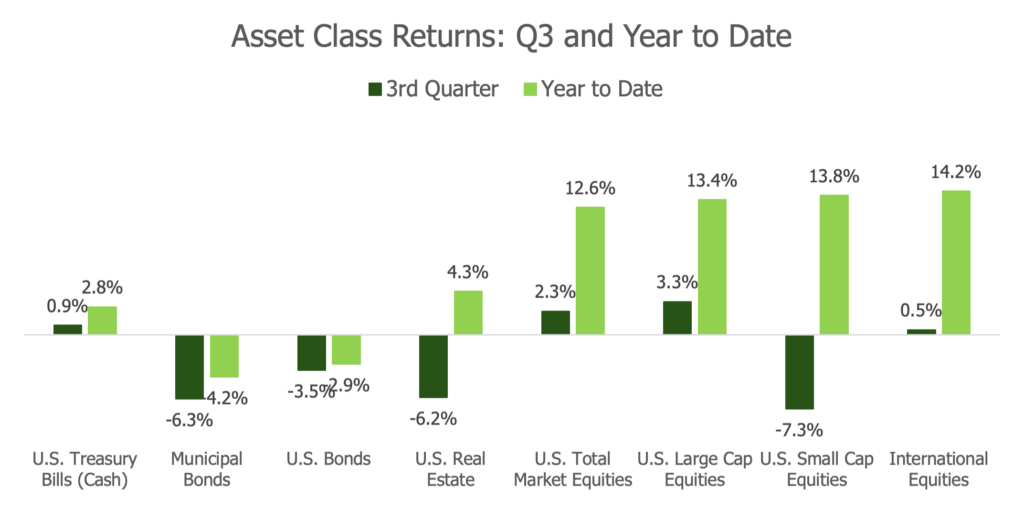
Global equities were up 0.8% in Q3. U.S. stocks (+2.3%) and Treasury bills (+0.9%) added to performance. U.S. small caps fell 7.3% on the quarter, though they’re still a top performer for the year.1

Strong operating results for publicly traded companies keep pushing corporate earnings and profit margins higher. In the latest reported quarter, S&P 500 headline earnings grew 50.4% (operating earnings grew 23% once stripping out massive non-operating investment gains from giants like Alphabet and Amazon), and net profit margins hit 16.9%, up from 14.8% the prior quarter.2

Fixed income had a tough quarter. The 10-year Treasury yield jumped from 4.44% to 5.29% since the end of June (pushing prices lower). U.S. taxable and tax-exempt bond total returns fell 3.5% and 6.3%, respectively.3 We’ll come back to what this means shortly.

Source: YCharts, 12/31/2025-9/30/2026, Indices – Bloomberg US Treasury Bills 1-3 Month, Bloomberg Municipal Bond, Bloomberg US Aggregate, MSCI USA, MSCI USA Large Cap, MSCI USA Small Cap, MSCI US IMI Real Estate 25-50, MSCI ACWI Ex-USA Net

The Economy

Economic growth, as measured by real GDP, came in at 2.2% for Q2 2026 (reported in Q3), up slightly from 2.1% in the prior quarter.4 Total U.S. corporate profits (which includes all public and private companies) jumped 8.9% in Q2, the largest increase in five years, and are up 20.8% from a year ago.5

Inflation remains sticky, and it’s forcing the Federal Reserve’s hand. The Consumer Price Index (CPI) is running at 3.4%. That’s below May’s 4.2% peak (jump following Iran War), but still well above the Fed’s 2% long-term target.6

The Narratives That Matter

We’ll start with the narrative that shows up every time stocks hit a new high: the warning to get out. We’ve seen 29 record highs this year, a handful of them in Q3.7

All-Time Highs

No one wants to be left holding the bag. It’s the flip side of the fear of missing out, and news outlets know it. We’ve shared more formal thoughts in Worth Noting: All-Time Highs Are Not a Warning Sign, so we’ll keep this short.

First, step back and ask why markets are at highs. Are stock prices getting ahead of themselves? Or are they tracking (or even lagging) the operating businesses they represent? The first should concern you. But that’s not what the numbers are showing today.

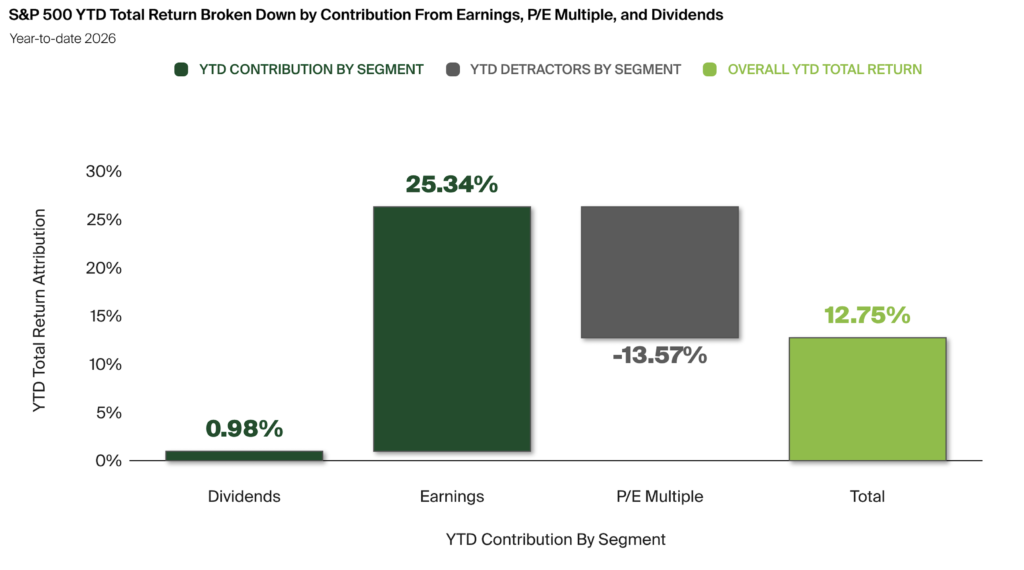
So far this year, S&P 500 earnings (i.e., profits) are up 25.34%, well above the market’s total return of 12.75%.8 This means that publicly traded businesses are getting cheaper relative to their underlying profits, not more expensive.

Those of you who have invested long enough know all too well that anything can happen in markets. But stocks hitting record highs against a backdrop of record profits are not necessarily a reason to think the other shoe is about to drop.

Source: © Exhibit A, FactSet Research Systems Inc., Standard & Poor’s, 12/31/2025-9/30/2026.

It’s Not Just a Few Big Companies Either

The pushback you’ll hear is that the stock market is too concentrated, and profits are coming from a handful of multi-trillion-dollar companies.

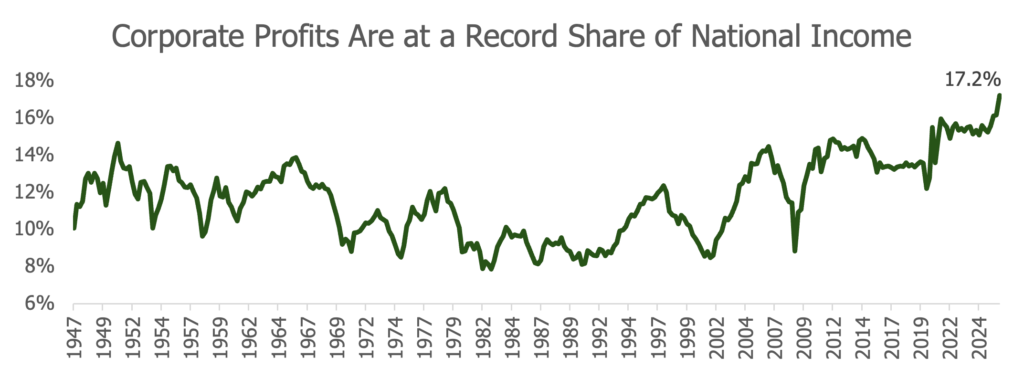
So, let’s look at all U.S. corporations, public and private, large and small, all combined. The story is the same. Profits are at a record share of national income, going back to 1947.

Source: Federal Reserve Bank of St. Louis (FRED), Bureau of Economic Analysis, 3/31/1947-6/30/2026, Corporate Profits with Inventory Valuation and Capital Consumption Adjustments (CPROFIT), National Income (NICUR).

Whether you own and operate a business directly, or you own small pieces of thousands of them indirectly through the stock market, you want to see this line moving up and to the right.

Now, the other side of rising profits and economic growth is that it keeps measures of inflation higher. And that takes us to the Fed and the bond market.

The Fed Raises Rates

In an attempt to keep the economy from overheating, the Federal Reserve raised its overnight policy rate by 0.25% at its September meeting, to a new target range of 3.75% to 4.00%. It’s the first hike since July 2023, and an about-face from six previous cuts totaling 1.75%.9

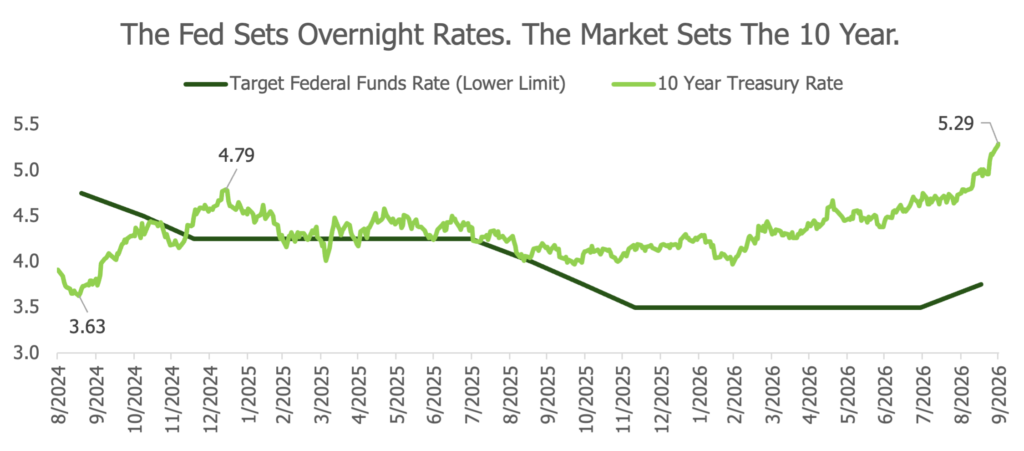
The Fed controls overnight rates. Further out along the maturity curve, bond yields more so reflect the market’s expectations for growth and inflation, plus what investors demand to lock up their money longer. Then you need to add adjustments for expectations of bond supply, fiscal deficits, and countless other pressures. It gets complicated.

You can see this below. The Fed cut rates by 0.50% in September 2024, and the 10-year Treasury yield rose from a low of 3.63% to a high of 4.79% by January, an increase of 1.16%. The Fed cut three more times in late 2025, and the 10-year went higher still. The opposite of what many would expect.

Source: YCharts, Federal Reserve, Department of Treasury, 8/30/2024-9/30/2026

It’s too soon to know how longer-term rates will respond to September’s hike. But it almost certainly won’t line up neatly with what the Fed does. It’s not that the Fed can’t influence the bond market, it most certainly can. But you can’t simply add or subtract what the Fed does to your own bond portfolio.

The Bond Selloff in Q3

It came from all angles this quarter: more Treasury debt, more corporate debt to fund AI, more municipalities coming to market, sticky inflation, wars, fiscal pressures. You name it. It all seemed to hit at once.

Headlines will focus on daily moves in yields and prices, which misses what a long-term bond investor actually experiences. Over full bond terms, returns mainly come from yield, meaning the income you receive. That income is paid over time, monthly for funds or even as little as twice a year for individual bonds. But price changes happen right away. That mismatch in the timing of your sources of return confuses even seasoned investors.

When bond prices fall, yields rise, and so do expected future returns. For longer-term bond investors, this is what you want. This quarter’s selloff pushed yields to levels we haven’t seen in more than 20 years. It takes time for bonds within a fund or a broader portfolio to roll off and recycle to newly available higher yields.

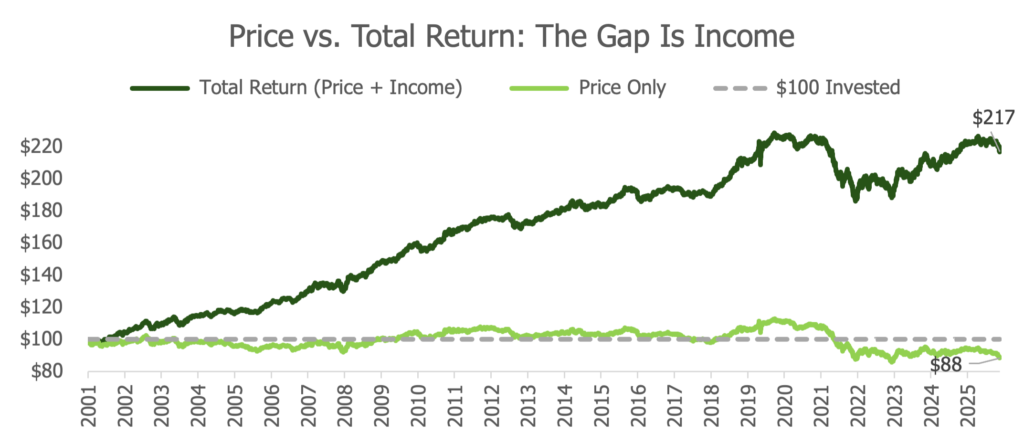
Bonds are income investments. Since 2001, the broad U.S. bond market’s net return has largely come from income, rather than price appreciation. Prices move around all the time, but the individual bonds that make up the market pull back to par as they approach maturity.10 What’s left in the end is the income you received through time.

Source: YCharts, 11/12/2001-9/30/2026, Vanguard Total Bond Market Index Fund Admiral (VBTLX), dark green line assumes monthly distributions reinvested. Note: figures are different from whitepaper below due to end dates.

If you’d like to dive deeper into bond returns, check out our latest whitepaper, The Role of Bonds in a Portfolio.

A Recent Example of Markets Looking Forward: SpaceX’s Share Unlock

This isn’t a view on SpaceX, IPOs, or where the stock goes next. But it is a useful example of one of our core principles: markets generally work, and they do a decent job of pricing in all known information.

SpaceX came public in June with a historically small public float (the shares available to trade) and a set schedule for exactly when more shares will become eligible for sale. That created enormous concern that the added supply would pressure the stock and cause all sorts of issues for investors, funds, and indexes all around.

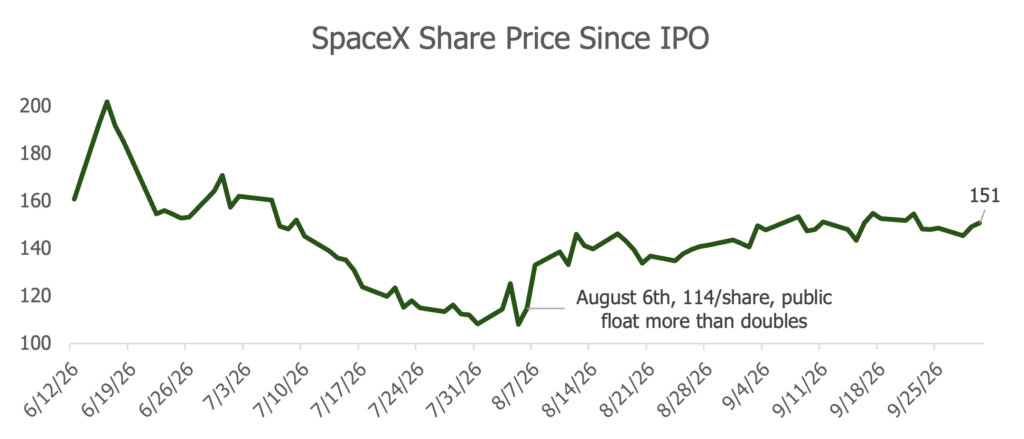
The first major unlock came August 6, when ~911 million shares became eligible for sale from insiders. The public float jumped from ~5% to ~12% of shares outstanding.11 None of this was a surprise. The schedule was public, the supply concern was widely discussed, and the stock had already been cut roughly in half from its all-time high.

Then the new batch of shares unlocked. Instead of new shares adding even more selling pressure to an already beaten down stock, the market absorbed the shares, and the stock is up ~40% off its low which was hit the day before the unlock.12

Source: YCharts, 6/12/2026-9/30/2026, share price only shown, not returns.

Everyone knew that more supply was coming. Many investors who wanted out of the stock were already out.

The same idea applies to bonds today. Yields are higher exactly because they reflect widely held concerns about debt, deficits, supply, and inflation. Once those worries are priced in and expectations get negative enough, the feared events can still happen and prices can still recover. Often in markets, “exactly as expected” or “less bad” is enough to reverse a trend. Similar patterns have occurred in stocks following past selloffs. It just wasn’t their turn this quarter.

What This Means for Long-Term Investors

We all need to get comfortable with the noise. We’re taking in news at a pace that’s off the charts compared to even a few years ago. If you let it, that makes staying invested harder than ever.

That is what this Numbers & Narratives series is all about. We want to slow down and provide perspective.

For long-term investors, the principles remain simple, even if execution is not. Stay invested if it aligns with your plan. Diversify across asset classes and geographies. Be mindful of costs and taxes, both of which compound quietly over time. And remember, by the time headlines reach fever pitch, the market may have already reflected much of that information.

1 YCharts, FTSE Global All Cap Index, MSCI USA Total Return Index, Bloomberg US Treasury Bills 1-3 Month Total Return Index, MSCI USA Small Cap Total Return Index, data as of 9/30/2026

2 FactSet, fiscal Q2 2026 results. The 16.9% net profit margin is the highest on record since FactSet began tracking the metric in 2009. While headline earnings growth reached 50.4%, this figure was heavily inflated by non-operating unrealized investment gains from mega-cap outliers, meaning core operating earnings expanded by a normalized 23%.

3 YCharts, U.S. 10 Year Treasury Rate, Bloomberg US Aggregate, Bloomberg Municipal Bond, 6/30/2026-9/30/2026

4 YCharts, Bureau of Economic Analysis, US Real GDP QoQ Annualized Growth, 9/30/2026

5 YCharts, Bureau of Economic Analysis, Corporate Profits with Inventory Valuation and Capital Consumption Adjustments, 6/30/2026

6 YCharts, Bureau of Labor Statistics (BLS), as of 8/31/2026

7 YCharts, 12/31/2025-9/30/2026, S&P 500 Index, TFO calculations

8 Exhibit A, FactSet Research Systems Inc., Standard & Poor’s, 12/31/2025-9/30/2026

9 Federal Reserve, Federal Open Market Committee, September 2024-September 2026

10 This assumes the bonds do not default and is referring to an investment-grade (high quality) market.

11 Bloomberg, Reuters, 8/5/2026, TFO calculations

12 YCharts, 8/5/2026-9/30/2026, closing prices ($108/share low)

Advisory services provided by TFO Wealth Partners, LLC. We believe this information provided is reliable, but do not warrant its accuracy or completeness. This material is provided for informational purposes only.

Asset allocation and diversification do not assure or guarantee better performance and cannot eliminate the risk of investment losses. Past performance may not be indicative of future results. Therefore, no current or prospective client should assume that the future performance of any specific investment or strategy will be profitable or equal to past performance levels. All investment strategies have the potential for profit or loss. Different types of investments involve varying degrees of risk, and there can be no assurance that any specific investment will either be suitable or profitable for a client’s portfolio. There are no assurances that a portfolio will match or outperform any particular benchmark.

573aWP – 2026.10

white-dots white-dots

Ready to review your current wealth plan?

Getting started is easy. Set a time to talk.

Let’s Talkarrowarrow